The use of interims during COVID-19
By the end of the 2020-21 school year, when local and state education agencies continued to grapple with the challenges imposed by COVID-19, California found itself in a unique position when it came to measuring students’ academic performance. Though many states pursued a similar approach, California was the only state in the nation to receive approval from the U.S. Department of Education to use either state summative assessments or interim assessments to meet the federal requirement to annually assess students in English Language Arts (ELA) and math.
As a result of the waiver, local education agencies (LEAs) in California were permitted to administer an alternative to the state summative test (the Smarter Balanced assessment, or SBAC) in cases where it was not “viable” to give the SBAC, as long as the alternative test met a set of criteria established by the state board of education. Many LEAs chose to administer interim assessments instead of the state summative assessment, especially in grades three through eight (in contrast, in grade 11, SBAC was more commonly administered). Motivations for this choice include that interim assessments were more efficient to administer in a remote environment, many schools were already planning to administer them, students had more familiarity with their online platforms, and their results were already familiar to educators.
There has been much debate about the use of interim assessments to measure the proportion of students who are meeting or exceeding standards instead of summative assessments, given the differences in intended purpose, design, and stakes. Schools and LEAs have historically administered and used interims to measure what students know both during and at the end of the school year. Though interim assessments are designed with a different purpose than state summative assessments, interim assessment data enable the timely examination of the effects of COVID-19 on student learning and can be used by educators to monitor and support recovery over time.
At Education Analytics, we have helped LEAs in California (and beyond) use interim assessment data to understand student growth and achievement in order to inform practice and policy. We have analyzed and reported data from the MAP, i-Ready, Star, and Reading Inventory interim assessments in a number of ways:
- Rally Analytics Platform: An educator-facing dashboard with historical and current interim and state assessment data, student survey data, and a number of tools to organize students and monitor student success.

- Learning Lag and Recovery Reports: Aggregated reports we produce for LEAs that capture COVID-related changes in learning across grades and student groups.
- Compliance reporting for schools and districts: Comprehensive spreadsheets we produce for LEAs that contain participation and performance data by student group and interim type. Regardless of which assessment LEAs used in spring 2021, they were still responsible for reporting the percent of students who completed an assessment and the percent of students meeting/exceeding standards. These spreadsheets converted scores on each interim assessment to corresponding estimates of meeting/exceeding standards on the state summative assessment, and they replicated the state’s complex rules determining which students are assigned to which demographic groups.
Analyzing student participation and performance in California during COVID-19
In addition to providing analytics and reports directly to individual LEAs, we have leveraged our comprehensive data system to answer questions of pressing concern to policymakers. For example:
- What proportion of students participated in an assessment in the spring of 2021? Was this substantially lower than participation rates in pre-COVID school years?
- What do aggregated achievement and growth look like in comparison to pre-COVID school years?
Using data from the 2018-19 and 2020-21 school years, we analyzed trends in both test participation and student performance. Here, we report trends based on data from 47 LEAs in California and approximately 370,000 students in grades 3-8 and 11 (i.e., the grade levels that are tested each year with the SBAC). We include results from both interim and state assessment data because there was more widespread administration of the state test in 11th grade. Note that there may be some LEAs for whom we have incomplete data (e.g., if we have received some but not all of the assessment data for an LEA), so we have restricted our results to include only those LEAs where we have 2020-21 assessment data for at least 25% of students. In cases where an LEA administered more than one type of assessment, we only display results for the assessment that had the largest proportion of students participating. We also only display results when at least 10 students are represented.
Participation in California assessments
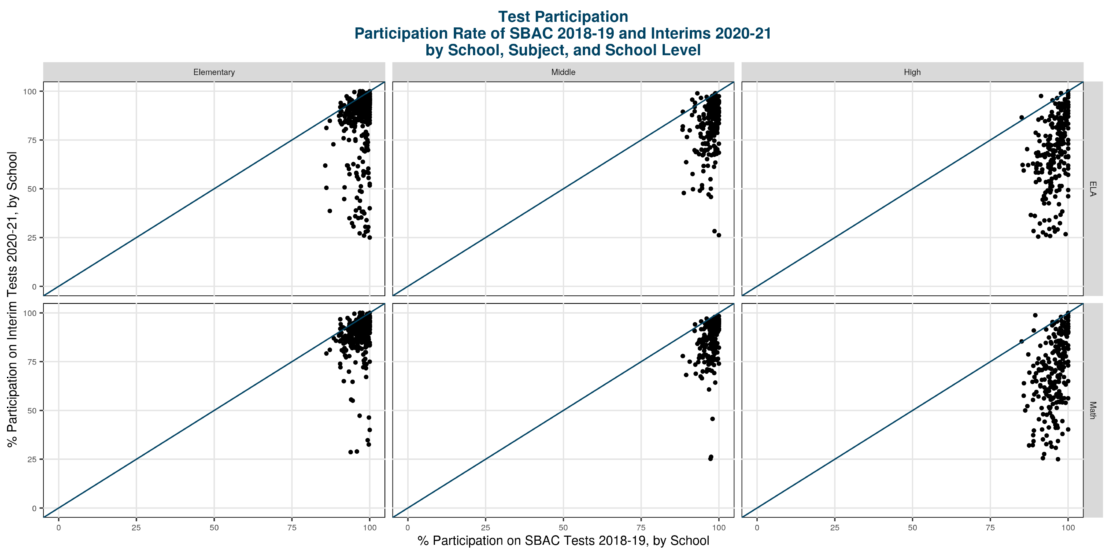
The plots below compare the participation rate in 2018-19 (on the horizontal axis) with the participation rate in 2020-21 (on the vertical axis), with each dot representing one school in our sample. Results are displayed separately by subject (ELA on top, math on bottom) and by school level (elementary, middle, and high). The blue diagonal lines denote when the participation rate is the same across years; schools above that line had higher participation in 2020-21 than 2018-19, whereas schools below that line had lower participation in 2020-21 than 2018-19.
Our analyses show that although 2020-21 test participation was lower than in 2018-19 overall, the majority of elementary and middle schools maintained a high proportion of students participating in spring 2021 assessments (with some exceptions). Participation was somewhat higher on math assessments than ELA assessments in elementary and middle schools, as shown by the clusters of schools in the top right of those panels being tighter for math than ELA. High school test participation showed more variability than for elementary and middle school, and patterns were more similar across ELA and math in high school.
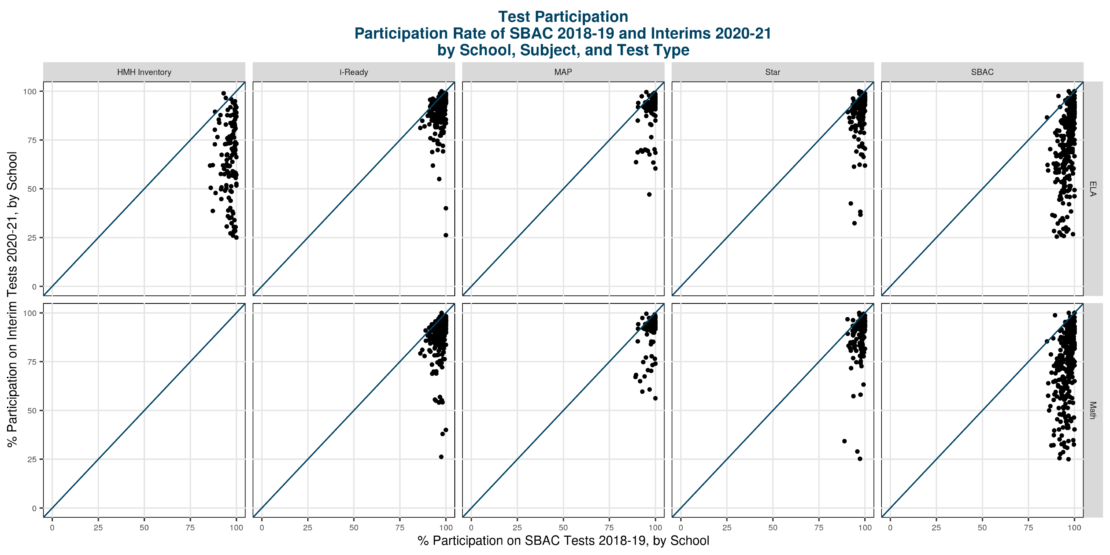
Given the range of interim assessments used, it is also possible to examine test participation by the type of test taken in 2020-21 (displayed across the top of the panels in the figure below). The percent of students completing a spring interim remained fairly high in 2020-21 in LEAs administering i-Ready, MAP, and Star, with a more substantive drop in participation in LEAs administering HMH Reading Inventory and SBAC (note that we did not have enough student data from HMH Math Inventory to report here). Recall that SBAC was more likely to be administered in 11th grade, so the schools in the SBAC panel below are more likely to be high schools than in the other assessment panels.
Performance on California assessments
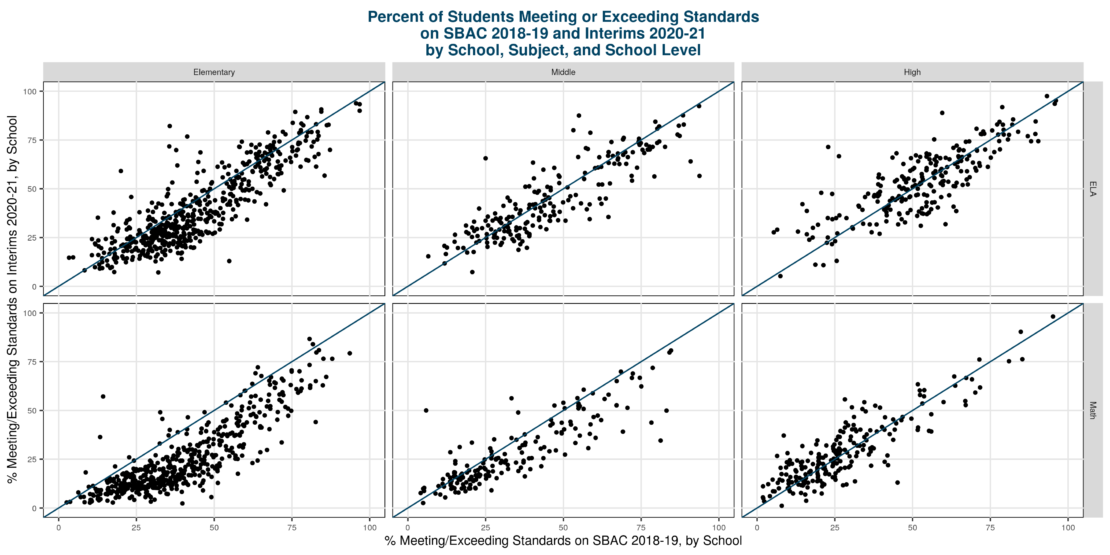
In addition to the analyses of participation rates, we examined how student performance in 2020-21 compares to performance in 2018-19. In the plot below, we compare the percent of students meeting or exceeding standards in 2018-19 (on the horizontal axis) with the percent in 2020-21 (on the vertical axis) separately by subject (ELA and math) and school level (elementary, middle, and high). Schools falling above the blue 45-degree line had a higher percentage of students meeting/exceeding standards in 2020-21 than in 2018-19, and schools falling below the 45-degree line had a lower percentage in 2020-21 than in 2018-19.
Results show that the percent of students meeting/exceeding standards has declined in 2020-21, consistent with many research reports on the impact of COVID-19. This is especially true in elementary schools, where the majority of schools have lower student achievement in math and ELA. At the middle school level, schools tend to be lower performing in math in 2020-21 than pre-COVID, but less so for ELA. In high school, we see more variability in whether the percent of students meeting/exceeding standards is higher or lower in 2020-21 in both ELA and math.
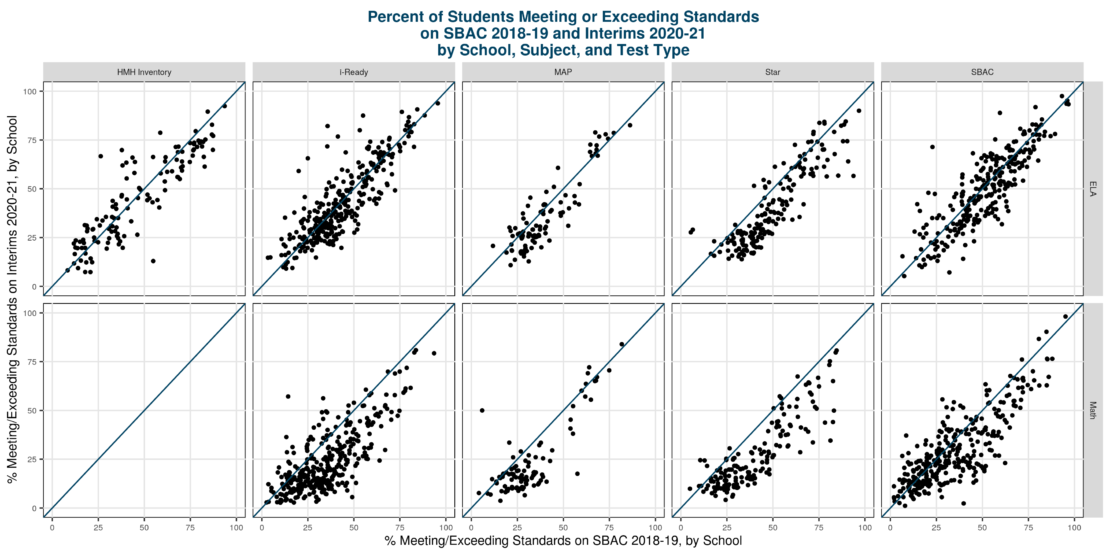
We can further examine changes in student performance by test type. In the figure below, we see that the patterns in performance in 2018-19 vs. 2020-21 are generally similar for the interims (first four panels) as compared to SBAC (far right panel), with declines in performance more common in math than in ELA across assessments. Together, these results suggest that proficiency rates as measured by interims reasonably relate to those rates as measured by SBAC.
School spotlight: How Garfield Elementary helped their students improve
Although there is ample documented evidence of “learning lag,” or slower academic growth compared to pre-COVID school years, there are also cases where the opposite is occurring. In our data, we have evidence of several schools that are showing results that are better than expected in 2020-21. Here, we share one example, from Garfield Elementary in Santa Ana Unified School District (SAUSD), and we highlight the steps their educators took to support student learning and growth during COVID-19.
Supporting technology use: In the 2020-21 school year—when instruction in SAUSD remained virtual for the entire year—SAUSD used funding for COVID recovery to purchase Chromebooks for all students in transitional kindergarten through second grade. Additionally, Garfield staff ensured that all students had both a Chromebook and a Wi-Fi hotspot. In summer 2020, teachers across the district received extensive training on the digital education platforms that would be used to deliver instruction to students (such as Google Classroom, NearPod, Zoom, and others). Garfield’s principal, Dr. Kerri Braun, worked closely with teachers to ensure they felt confident in using each of the platforms, and she modeled how to use each platform at every staff meeting to immerse her teachers in the experience from the perspective of a student. The school also streamlined their communication with parents using Parent Square as the singular platform for communication, and they provided training for families on how to use the platform.
Delivering instruction: The school committed to completing a daily check-in with every student using NearPod or Google Forms to find out how they were feeling and how ready they felt for the day’s instruction. The instructional leadership team worked with Dr. Braun to ensure that every grade level committed to the same instructional schedule, which provided structure and routine for students learning virtually across the school. Dr. Braun prioritized visiting every virtual classroom multiple times a week to engage with teachers and students in the classroom environment. Teachers offered one to two hours per day of office hours, during which time teachers provided one-on-one instruction to students in content areas where they were struggling, or met with parents to address divides in technology knowledge. In turn, Dr. Braun offered office hours each week for her staff, so that they could come and share their needs, concerns, or struggles individually or as a grade level.
Supporting families: In conjunction with office staff and a community liaison, Dr. Braun held monthly virtual parent meetings to address questions and concerns from the community. The school site held technology hours to train parents in how to access the different digital platforms used at the school. For any student who had excessive absences, Dr. Braun conducted a home visit to determine what barriers were inhibiting the student and family from accessing online instruction.
Dr. Braun attributes the growth of Garfield’s students to the deep dedication of the educators and support staff at the school. Social-emotional wellness was at the forefront of the school’s work—not just for students, but for families and teachers as well.
Looking back and looking forward
COVID-19 has inflicted a wide range of obstacles on students, families, educators, and school systems. Accurately measuring how much students have learned during the pandemic, while remaining flexible to the shifting realities facing students and educators, remains a top priority for schools across the country. These data from 47 California LEAs suggest that using interim assessments to provide a snapshot of what students know was a reasonable option during the 2020-21 school year. Although participation rates and the proportion of students meeting or exceeding standards have both fallen in 2020-21 relative to pre-pandemic rates, higher participation on interims relative to the SBAC last year suggest that we may have a more complete picture of student knowledge using interims in the 2020-21 school year. However, it is important to note that the interim assessments were administered in an environment free of consequences, and that if any stakes were attached to these results in the future—including more robust public reporting—then this might affect the results from interims.
As states and districts consider what these data might mean for the future, there are a range of possibilities for adapting and integrating this kind of flexibility into comprehensive assessment systems. Balancing the need for comparable reporting across districts with flexibility that optimizes local needs is a long-standing challenge only made more acute during COVID, meaning it is more urgent and possibly more appealing to consider innovative solutions to address it.
Initial analyses enabled us to identify schools that have progressed student achievement in unexpected ways during this unprecedented time. We are deeply grateful to Dr. Kerri Braun from Garfield Elementary in SAUSD for sharing her supportive and comprehensive approach. Deeper analyses could identify and catalogue other schools that have effectively leveraged resources to support recovery.


