Over the past year, Education Analytics (EA) has been working with our state and district partners and other education research groups across the country to better understand the many ways that COVID-19 has affected our country’s school systems. The necessary policy decisions that political leaders have had to make around closing schools and implementing a moratorium on standardized assessments have inevitably created significant data quality and data availability challenges for many different stakeholders who typically use those data for policy, practice, and research purposes. For many state and local education agencies, the lack of assessment data from spring 2020, along with limited attendance data from the 2019-20 school year, has forced them to reexamine how they calculate student, school, and statewide metrics (whether for accountability or informational purposes). Additionally, the challenges of remote instruction have introduced further obstacles to collecting school culture and climate or social-emotional survey data and have limited teachers’ ability to capture high-quality gradebook data.
In light of these data quality limitations, EA’s partners have asked us: What academic metrics are still possible to calculate, and how do we determine what we can and cannot responsibly report out to parents, teachers, and others who usually rely on these data? To support education agencies as they navigate this reality, EA developed a systematic approach for investigating the impact of missing data on various metrics we compute for our partners, and then making adjustments to account for those limitations.
How we interact with COVID-impacted data
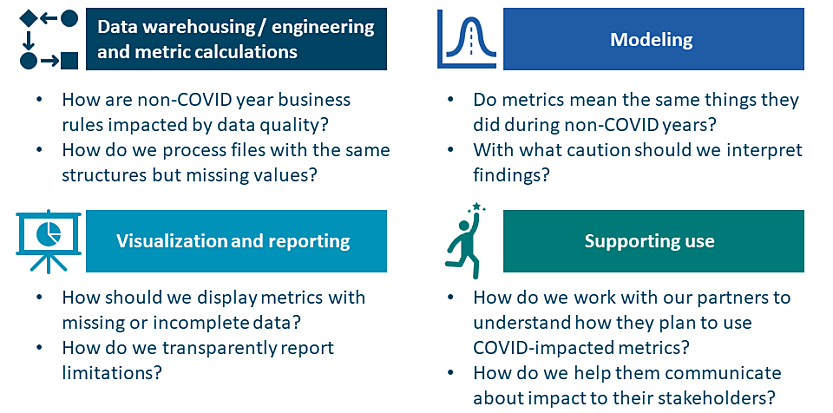
EA works with more than 70 partners across 28 states to conduct educational research and develop rigorous analytics using educational data, all in service of supporting actionable solutions and continuous improvement. Given our deep and expansive work around data warehousing, metric calculations, statistical modeling, and data visualization/reporting tools, EA is poised to support our many partners as they engage in data-driven decision making with data that have been limited, compromised, or altered due to COVID-19. To support our investigation of how COVID-19 has impacted educational data, we mapped out several crucial questions that we needed to answer:
For every partner, and for every data source, the answers to these questions differed based on how their metrics were calculated and the specific use case of the data itself. To document these key questions and decision points in greater detail, the EA team developed an externally facing Missing Data guide that other stakeholders in the field can use and apply to their own context. Next, we go into greater detail about how we used this guide in our work with CORE Districts, as they considered the responsible calculation and reporting of chronic absenteeism on the CORE Dashboard.
A case study: The CORE dashboard
EA has worked with CORE Districts—a group of local education agencies (LEAs) across the state of California collaboratively improving student achievement—for more than seven years. One of CORE’s key offerings to its CORE Data Collaborative members is access to a user-facing dashboard that reports a range of metrics:
To support this dashboard—which houses data for about 4 million students across 200 LEAs in California—EA operates an automated data system that loads, cleans, organizes, calculates, analyzes, and reports these metrics. Given that one of EA’s highest priorities is ensuring the quality of data that populates the dashboard, EA worked very carefully with CORE Districts to review and diagnose data quality issues due to the impact of COVID-19. Here, we will focus on one of the metrics we considered: chronic absenteeism.
How did COVID-related missing data affect metric calculation decisions for chronic absenteeism?
In a typical school year, we calculate chronic absenteeism using the attendance data file that is uploaded to the CORE data system at the end school year by the CORE Data Collaborative members. After performing quality control checks on attendance data for 2019-20, we learned that most districts reported attendance data only through mid-March (~120 total days enrolled), while a subset of districts reported attendance data through the end of the school year (~180 days enrolled). This prevalence of partial-year data is likely due to guidance from the California Department of Education (CDE) stating that attendance data for 2019-20 needed to be reported through February 29th (but no later) to meet the state’s requirement for reporting average daily attendance. However, as described in more detail below, the rates of chronic absenteeism across the CORE Data Collaborative were strongly correlated between the 2018-19 school year (during which schools and districts reported 180 days of enrollment) and the 2019-20 school year (with most schools and districts reporting partial year enrollment); this empirical finding validated our decision to accept all attendance data reported, regardless of end date.
Although the end date for calculating chronic absenteeism is sourced directly from the attendance file (and is based on the total number of attendance days reported), we also use additional data sources to calculate a continuous enrollment measure that links the metrics on the dashboard to student demographics. This continuous enrollment measure, which is calculated as the enrollment from the state Fall Census Day in October to the date of testing administration (per CDE guidelines), allows us to report chronic absenteeism by student group. After reviewing the business rules and file sources for calculating continuous enrollment, we recognized that we would not have a Smarter Balanced assessment file this year (given the moratorium on assessment administration due to COVID-19) and determined that we needed a new source of truth for the end date. To address this concern, we set the “cutoff” date for the end of 2019-20 school year to be the last day of in-school instruction, February 29th, 2020 (based on CDE guidelines).
How did COVID-related missing data affect methodology decisions for chronic absenteeism?
When evaluating methodological decisions for the CORE dashboard metrics, our research team first considered whether data were completely missing (e.g., standardized assessment data for 2019-20) or if there was partial data availability. As the majority of the CORE Data Collaborative members reported attendance through mid-March of 2020, there was partial-year data coverage for chronic absenteeism. Our next step in determining whether we could responsibly report chronic absenteeism using the partial year data was to compare the chronic absenteeism rates from the previous full school year (2018-19) to the chronic absenteeism rates from the 2019-20 shortened year. Our goal was to answer the question: Did the reduced number of days in the school year change the interpretability of the chronic absenteeism metric compared to a full school year?
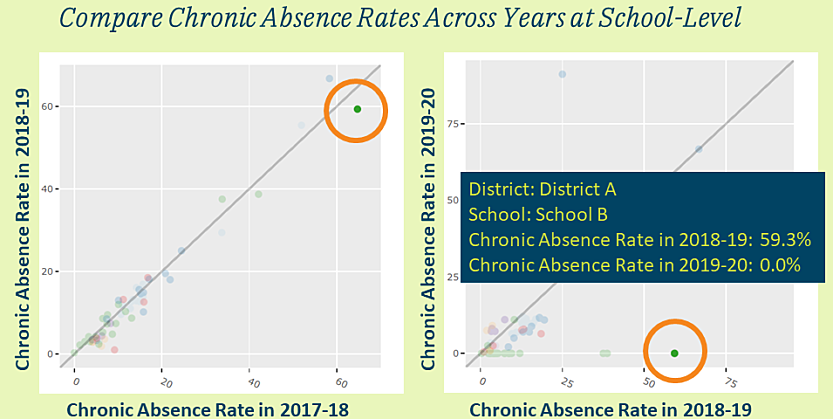
As mentioned above, our analysis showed that the year-over-year correlations between full-year and partial-year chronic absenteeism across the CORE Data Collaborative were high, and it suggested that the 2019-2020 metric still produced valuable information, even given the shortened school year. However, our analysis also indicated that, for a small subset of schools, partial-year data was not a good proxy for full-year data.
An example of the limited coverage of partial-year attendance data is shown for “School B” in the graphic below, which compares the correlation between schools’ chronic absence rate in 2018-19 and in the prior year (on the left), versus their rate in the 2019-20 partial year and in the prior year (on the right). When discussing these findings with our partners at CORE, we recognized that the weak correlations for some schools was an understandable outcome given that several months were missing from the 2019-20 calculation but did not undermine the overall value of including the metric. Additionally, we felt that the use case was important to recognize: for 2019-20, the dashboard data would not be used by CORE Data Collaborative members for high-stakes decision making due to the state suspending its accountability plan requirements. Thus, due to the year-over-year correlations of chronic absenteeism across the data collaborative and the lower-stakes use of the data in 2019-20, CORE and EA jointly decided to report chronic absenteeism on the CORE Dashboard for 2019-20.
How did COVID-related missing data affect front-end visualization decisions for chronic absenteeism?
Finally, the CORE and EA teams reviewed what adjustments might need to be made to the user-facing CORE dashboard itself, in order to transparently communicate the impacts of the limited and missing data to stakeholders. As the CORE and EA teams had already decided that it was appropriate to report the partial-year chronic absenteeism metric for 2019, our main consideration was how to report it to users, and if any additional framing or annotations were needed. Ultimately, CORE and EA decided to acknowledge the limitations of the partial-year data on the dashboard in several ways:
- All dashboard metrics impacted by COVID-19 policy decisions (due to adjusted business rules, limited data availability, etc.) were annotated on the dashboard by an asterisk “*”.
- Tooltips for all dashboard metrics impacted by COVID-19 were adjusted/updated to reflect those impacts (as shown in the graphic below).
- CORE developed a 2019-20 CORE Dashboard Guidance document summarizing the front-end changes made in response to COVID-related missing data issues.
All of these decisions supported the CORE and EA teams’ goal to responsibly display data and metrics on the CORE dashboard and ensure that dashboard users understood any data or metric limitations.
Our high-level recommendations to other stakeholders
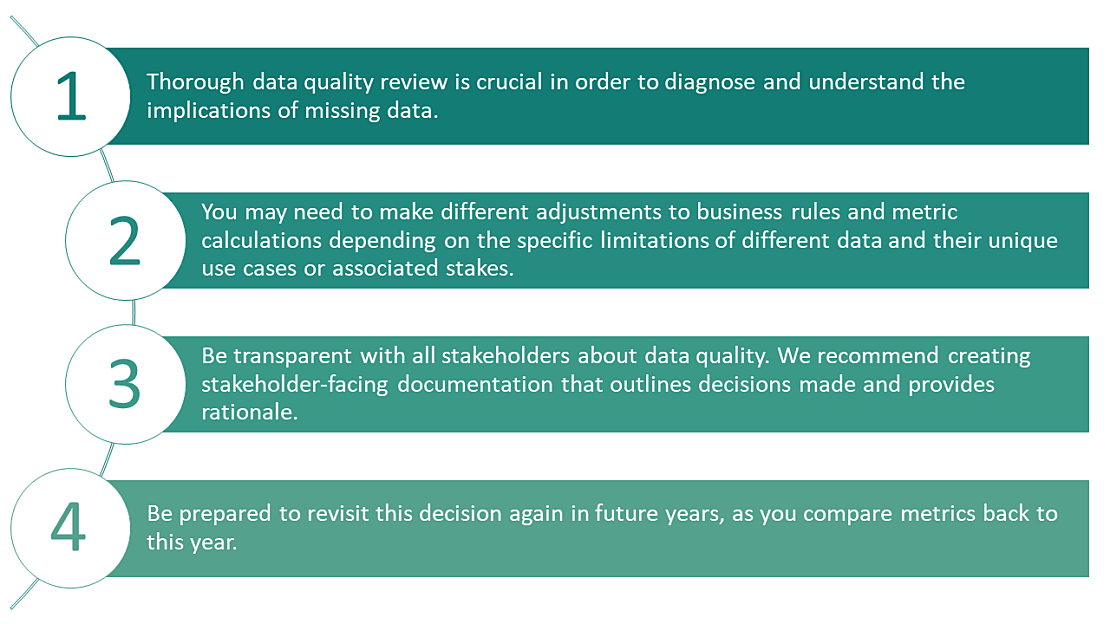
Based on our close work with CORE and our many other partners impacted by COVID-year data, we have identified several key best practices that we would recommend to other stakeholders as they unpack the ramifications of missing and limited data on their analytics and reporting:
What’s next?
As we see a shift toward in-school instruction at the end of the 2020-21 school year, we recognize that our partners will continue to be required to make new business rule and policy decisions in order to account for the lasting impacts of COVID-19 on data availability and data quality. In particular, it is crucial for school and district leaders to be able to measure and understand where students are as they re-enter schools—both academically and socioemotionally—in order to implement interventions that can successfully address learning recovery and acceleration. To do this, EA and its partners must be creative about leveraging the data we do have to help answer the questions that remain—and the new ones that emerge—due to COVID. Some examples of such “outside-of-the-box” approaches include calculating learning lag due to COVID using interim assessment data, or targeting resources to particular students based on interim assessment data used to compute student growth. As education stakeholders work to first assess student and school needs and then provide adequate supports in response to them, EA is committed to exploring innovative approaches to serve the data and analytics needs of our partners and their students—as well as to share what we have learned with the broader education field—as we collectively emerge from the pandemic.


