
Test Participation During COVID-19
In November 2020, the South Carolina Department of Education (SCDE) requested—but did not receive—an ESEA assessment waiver because the department had concerns about students’ opting out of the state summative assessment (SC READY) due to the impact of COVID-19 on school engagement. The SCDE was concerned about drawing misleading conclusions about student learning and progress if a substantive portion of students were missing, particularly if some students or schools were more likely to be missing than others.
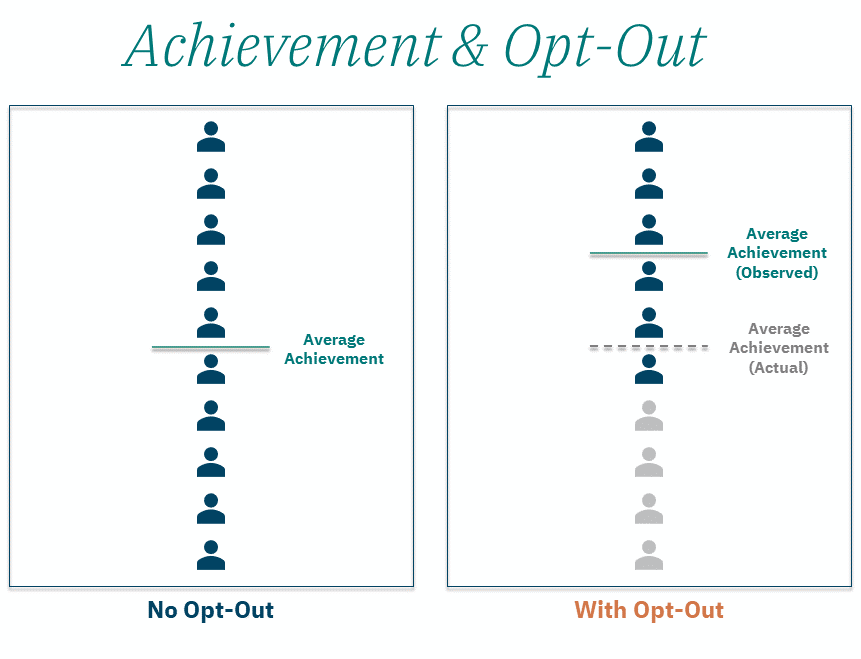
Specifically, there were concerns about how patterns of test opt out would affect measures of student achievement in 2020-21 and measures of student growth from 2018-19 to 2020-21 (given there were no state tests administered in 2019-20 due to the onset of COVID-19). For example, if students who had lower prior achievement were less likely to test (which is what we found), this would paint a rosier picture of achievement than reality, possibly leading to schools and students not receiving the kind of support and intervention they need to grapple with the ongoing effects of COVID-19 on learning opportunities. The image below depicts this scenario.
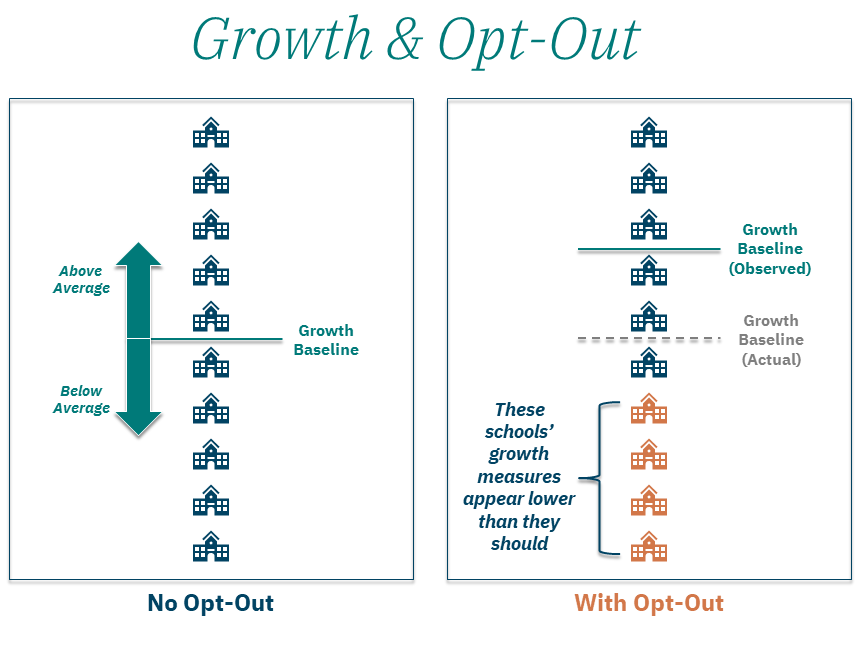
Furthermore, if opt-out was more common at schools with low academic growth than at high-growth schools (which is also what we found), school growth measures would be lower than they would have been without opt-out, which could again affect how supports are provided as well as affect a school’s public perception. The image below depicts that scenario.
In this blog, we describe analyses EA completed on behalf of the SCDE to help them understand the impact of test opt-out on student achievement and growth.
How did we measure the impact of test opt-out?
As mentioned above, students were not tested using the SC READY assessment in 2019-20 due to the COVID-19 pandemic. As a result, EA used a “skip-year” growth model to measure how much students grew in South Carolina over two school years (i.e., between Spring 2019 to Spring 2021, skipping over Spring 2020). These growth models make a prediction of students’ posttest score (in Spring 2021) based on their pretest score (in Spring 2019), and control for the average prior achievement of students in the same grade in the school—which accounts for the fact that students may learn more quickly depending on the starting point of other students in the school.
First, we used these models to understand the impact of opt-out on average achievement. For students who took the test, we simply used their Spring 2021 SC READY score. For students who opted out, we predicted their posttest scores using the skip-year growth models. We compared average school achievement in Spring 2021 both without opt-out students (i.e., observed performance) and with opt-out students (i.e., predicted performance) to get a sense of how average achievement would differ if those students would have tested.
Next, we examined the impact of opt-out on average growth. Growth is generated as the difference between a student’s actual posttest score and their predicted score. Since actual test scores are not available for opt-out students, we can only calculate growth based upon opt-in students. An individual school’s growth is measured relative to growth of all schools in the state. To evaluate the impact of opt-out on growth, we apply two different weighting strategies when calculating average school growth: one by total enrollment and the other by the number of students for whom we have a growth measure. Students with growth measures are those who opted into testing and who have the required pretests.
If we observe high opt-out and if opt-out is not random, weighting average growth by the number of students for whom we can measure growth (i.e., opt-in students) can affect schools’ growth measures. Specifically, if there is more opt-out at lower growth schools, then the baseline (meaning, average growth) is artificially inflated. This is because average growth will reflect that of high-growth schools disproportionately, relative to low-growth schools, when weighted by the number of students for whom we can measure growth (opt-in students with relevant pretests). In turn, an individual school’s growth appears lower compared to that baseline. This is what's depicted in the "Growth & Opt Out" diagram above.
Alternatively, weighting average growth by total enrollment (i.e., opt-in plus opt-out) accounts for the full population of students and recenters the average so that it is not affected by opt-out. Comparing average growth using these two methods allows us to observe the impact of opt-out on growth measures.
What was the impact of test opt-out?
Participation
Test participation in South Carolina was higher than expected (87%), yet still substantially lower than in 2019 when nearly all students participated (99.7%). However, as the figures below indicate, there are students who were more likely to have opted out: students who are economically disadvantaged (not shown), students with lower prior achievement (see Figure 1), and African American students (see Figure 2).
Figure 1. Participation Rates by Prior Performance

Figure 2. Participation Rates by Student Race/Ethnicity

Achievement
Given the relatively high rate of participation across the state, the impact of opt-out on average achievement was fairly small. Figure 3 demonstrates how the difference between those predicted to meet or exceed expectations and those who actually met or exceeded expectations (y-axis) varies by prior achievement (x-axis) in English Language Arts among middle schools. We expect this difference to be close to zero for schools with high test participation. Alternatively, if opt-out is non-random, we expect to observe larger differences between predicted and actual achievement for those schools with higher opt-out rates. The figure indicates that schools with low opt-out rates are clustered around the horizontal axis, showing minimal differences between predicted and actual achievement. However, we do see some schools with high opt-out rates (indicated by yellow/orange dots) that have larger differences. In particular, those dots below the x-axis demonstrate that for some schools with high opt-out among low achieving students, achievement tended to appear higher than it would have been without opt out.
Figure 3. Difference between Actual and Predicted Performance Rates in Middle School ELA

Growth
As mentioned above, opt-out may have an effect on the level of average school growth, depending on how it is measured. When we compare our two measures of average growth, we find that the average level of growth for each school is slightly higher if we weight by the number of students for whom we have a growth measure (opt-in students) than if we weight by a school’s enrollment (opt-in plus opt-out students). Given that we observe less opt-out at high-growth schools, it is likely that average school growth is overestimated when weighted by the number of students for whom growth can be measured. Using the full population of students (total enrollment) to weight average growth corrects for this. This correction was built into the 2021 growth measures EA provided to the SCDE.
What we learned
The Impact on Students and Schools
Historically, nearly all students across South Carolina have completed the statewide assessment, with 99.7% of students having tested in 2019. Test participation dropped in 2020-21 by 12 percentage points (from 99.7% to 87.4%), but participation was still relatively high. As a result, the impact of opt-out on aggregated achievement and growth was relatively minimal. Students who are economically disadvantaged, African American students, and students with lower prior achievement were more likely to opt out. These students are coming into this school year without information about what standards they have mastered, which puts them at a disadvantage relative to students with this information. These students are also those who are more likely to have been disproportionately impacted by COVID-19 with regards to learning and achievement. In schools serving high proportions of these students, achievement will be higher than what was predicted if opt-out students had been included. This means that schools and districts may be led to believe that student learning is in a better place in Spring 2021 than it actually is. It is important for districts and schools to understand these effects, as well as to seek out supplemental information about students’ learning (such as interim or benchmark assessments), in order to best serve those students who are in need.
Building a Correction into the Growth Model
When measuring growth for state reporting, we set the baseline for school growth using school enrollment as a weight, rather than the number of students who are included in the growth model, because this enrollment-weighted baseline is more robust to opt-out. Building this adjustment into our growth models ensures greater confidence in these measures in the presence of opt-out. For this reason, growth measures are an important metric to consider along with (or in some cases, in place of) achievement levels, given the effect of opt-out on growth is comparatively small, and we can more easily correct for its effect.
What comes next
EA and the SCDE are collaborating to build an “opt-out flag” into student-level reports to help educators identify students who do not have this information about their learning and to better support those students as they progress throughout the school year. Depending on how the assessment landscape unfolds in South Carolina in the future, the SCDE may be interested in expanding this work to understand the impact of opt-out on other kinds of assessments, as well as patterns over time.
Finally, EA continues to work with South Carolina and other states to measure the impact of COVID-19 on student learning. There is a clear connection to this work and being able to properly measure learning lag: How do our estimates of how much students’ learning is impacted by COVID-19 differ depending on who is tested? Building in adjustments based on enrollment, for example, into growth models was a key outcome of this study and is an area of further exploration when considering measures of learning lag.