By now, it is well understood that the impact of COVID-19 on the education system has resulted in concerning trends in students’ learning, mental health, and social connections. The body of evidence documenting the magnitude of those impacts and variation in those impacts across different students, schools, districts, and states continues to grow. Educators are also in the midst of implementing strategies and programs to directly address those impacts, as Elementary and Secondary School Emergency Relief (ESSER) funds have been distributed to all states as of January 2022. But as states and districts start to use those funds to implement their recovery plans, a critical question for educators, policymakers, and families is whether those recovery plans are working.
There is no doubt that recovery will take time, will be multifaceted and complex, and will be inequitable without disciplined and rigorous efforts to reach students who need the most support. Thus, measuring and monitoring recovery is one of the most important steps that educators across the educational ecosystem can take. Importantly, these different stakeholders—including teachers, school leaders, district leaders and central office staff, and state education agencies—may use similar kinds of data to monitor recovery, but the information they glean from those data and the actions they take as a result will differ, even if they are in service of the same goal of supporting students’ academic recovery.
A statewide analysis
At EA, we have been working with our partners at the South Carolina Department of Education since COVID-19 first closed schools to help them understand for these different stakeholders, and at these different levels, what learning lag and recovery looks like for their students. Recently, we shared results aggregated up to the state level to help the agency understand trends in student learning trajectories across South Carolina.
In our analysis, we compared students’ academic growth during COVID to their growth during a comparable pre-COVID time span. This analysis answers the question, how much slower (or faster) did students in the state grow during COVID compared to similar students in their grade before COVID? We use results from different interim assessments administered at four different timepoints—Fall 2020, Winter 2021, Spring 2021, and Fall 2021—to examine whether the trend over time shows continued lags in learning, or evidence of recovery.
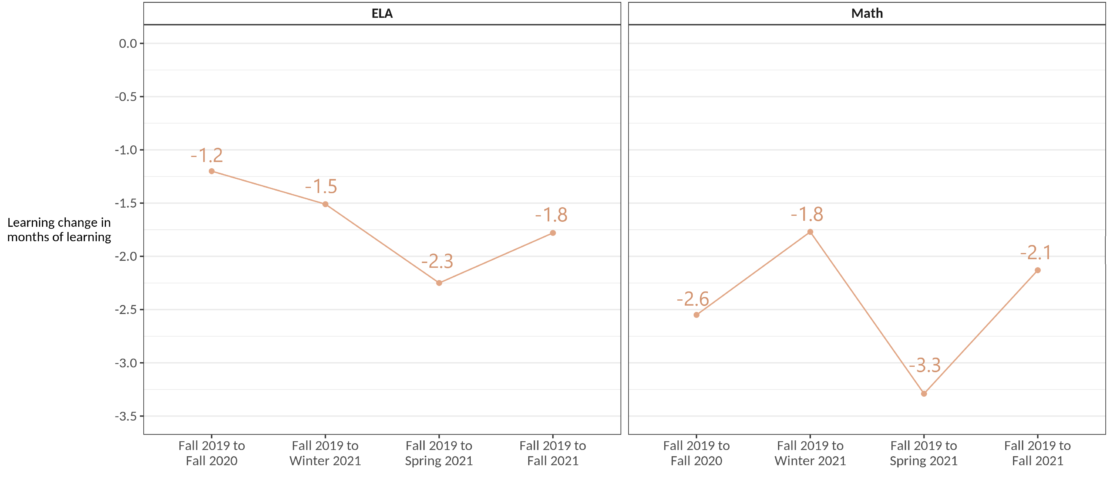
The good news, displayed in the figure below, is that we do see evidence of learning recovery in both English language arts (ELA) and math for students across the state. The less good news is that as of Fall 2021, students’ learning is still progressing more slowly than it did in the two-year period before COVID. What this means is that recovery is under way, but it will continue to take time before students are learning at the same rate they did pre-pandemic.
The figure below shows our estimates of learning lag for ELA on the left and for math on the right. Learning lag here is measured in “months of learning,” which is an approximate transformation of the results into a more intuitive metric based on a typical year of growth. In each panel, the four dots correspond to the four different assessments we used to track the trend of learning lag over time:
- The first dot shows the estimate of learning lag from Fall 2019 (before COVID) to Fall 2020 (during COVID) compared to a Fall-to-Fall pre-COVID period
- The second dot shows learning lag from Fall 2019 to Winter 2021 compared to a Fall-to-next-winter pre-COVID period
- The third dot shows learning lag from Fall 2019 to Spring 2021 compared to a Fall-to-next-spring pre-COVID period
- The fourth dot shows learning lag from Fall 2019 to Fall 2021 compared to a two-year fall-to-fall pre-COVID period.
Note that we fix the starting point (i.e., the pre-test) of the COVID-affected period across all four dots (so they all start at Fall 2019), but we move the end point (i.e., the post-test) to become more recent as you move to the right of the graph. This means that the graph is displaying the cumulative impact of COVID-19 over time as you move to the right.
In ELA, students experienced more learning lag over time from Fall 2020 through Spring 2021, followed by some recovery by Fall 2021. In math, students’ learning rates initially showed evidence of recovery between Fall 2020 and Winter 2021, but then even steeper lag by Spring 2021, followed by nearly equally-as-steep recovery by Fall 2021. The numbers are still negative for all time points, which means that student learning has not yet returned to pre-pandemic rates (which would be indicated by a dot at zero).
Patterns for different student groups
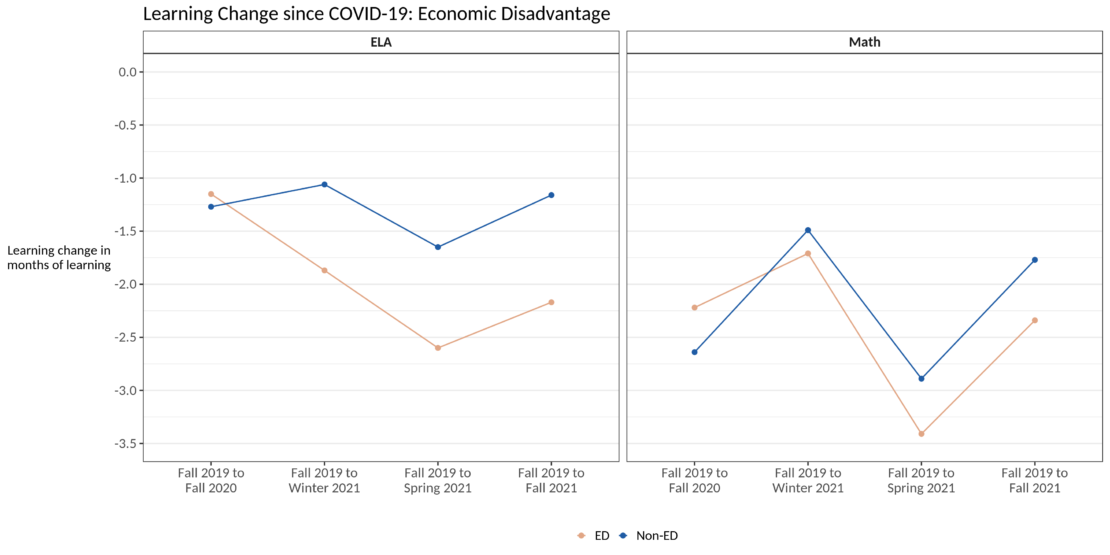
We can also examine these aggregate trends (across grade levels, across different assessments, and across schools and districts) for different groups of students, in order to understand variation in lag and recovery. Below are a few of these results. First, we can see the difference in lag and recovery patterns among students from economically disadvantaged (ED, in orange) backgrounds and those from non-economically disadvantaged (Non-ED, in blue) backgrounds. At the start of the pandemic, there was little difference in the magnitude of learning lag among these groups in ELA, but students from ED backgrounds experienced substantially more learning lag starting in Winter 2021 than their non-ED peers, and this gap has persisted through Fall 2021. In math, we initially saw more learning lag for students from non-ED backgrounds than those from ED backgrounds, but this pattern reversed in Winter 2021 and has persisted (with the gap widening a bit) since then.
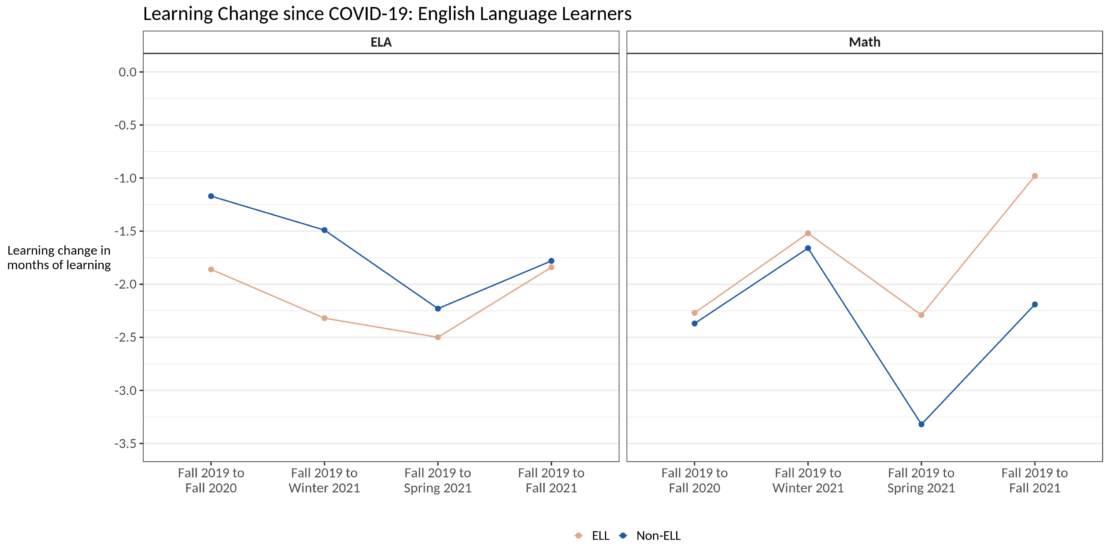
For students who are English Language Learners (ELL), shown below, we found an interesting pattern. In ELA, the difference in learning lag between ELL and non-ELL students has narrowed substantially over the pandemic. In math, however, there was minimal difference in learning lag between ELL and non-ELL students at the start of the pandemic, but non-ELL students experienced substantially more learning lag starting in Spring 2021 (and persisting through Fall 2021). In both subjects, ELL students in the state are showing evidence of recovery as of Fall 2021 relative to learning lag earlier in the pandemic.
Digging deeper into variation
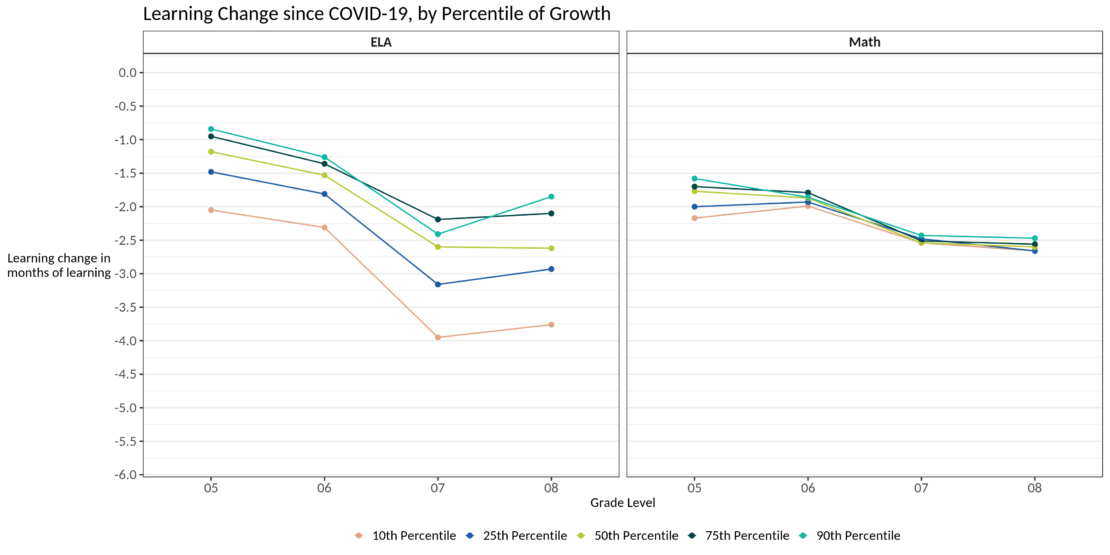
In addition to monitoring how learning lag and recovery are unfolding over time, we also dug a bit deeper into the most recent results to not just understand the average amount of learning lag, but also the variability of learning lag for different students. The figure below shows the amount of learning lag from Fall 2019 to Fall 2021 (our most recent results) separately by grade (on the horizontal axis) for ELA (on the left) and for Math (on the right). The different colors indicate different percentiles of growth; for example, the orange line shows the estimates of learning lag (at each grade) for students at the 10th percentile. What this compares is how growth from fall 2019 to fall 2021 (during COVID) for students in the 10th percentile compares to growth pre-COVID for students in the 10th percentile.
What these results show is that even though average learning lag (across grades and across different interim assessments) as of Fall 2021 is more severe in math (-2.1 months of learning) than in ELA (-1.8 months of learning), the variability is much wider in ELA. This mirrors a general pattern we found between student subgroups: we see larger differences between student groups in ELA than in math.
What these results suggest
All of the results above suggest two main takeaways:
- Learning lag in math has been more severe than learning lag in ELA, on average, suggesting that a universal approach to accelerating learning may be beneficial
- Learning lag in ELA has been more variable than learning lag in Math, suggesting that targeting specific students (using data like the ones we use here) for accelerated learning in ELA is a better use of resources than a universal approach
What’s next
As soon as data are available for Spring 2021, we will be extending these analyses for our partners in South Carolina to not only continue to monitor the extent of learning recovery, but also to uncover the bright spots and areas of greatest need within the state. By drilling down to the district and school level, we plan to assist the SCDE with understanding where recovery is strongest so they can seek to learn what strategies those schools and districts have been using. In turn, this will help the state understand not only how much learning has recovered during the two years since the pandemic, but also why learning might be recovering at the rate that it is in certain places.


