
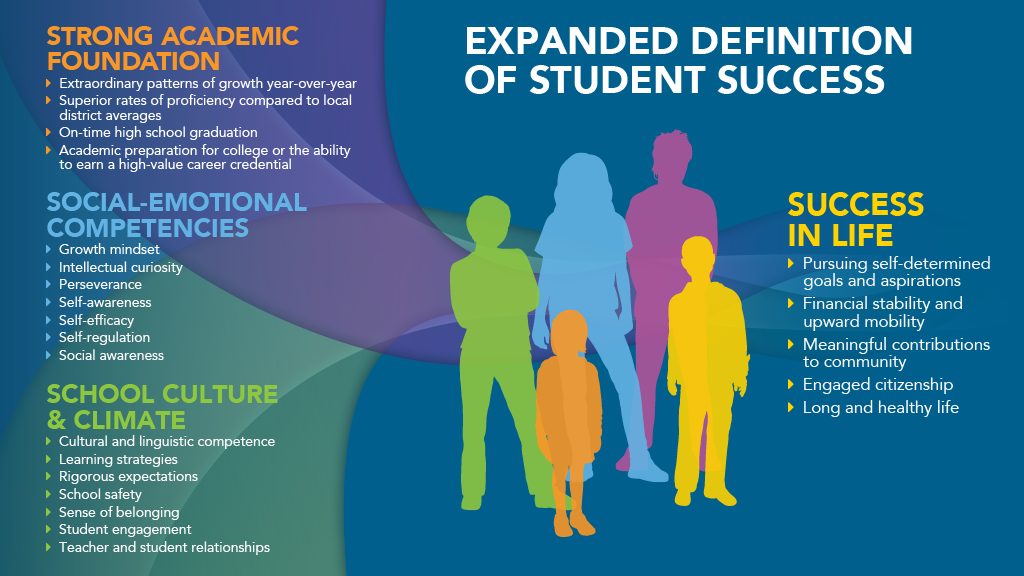
NewSchools Venture Fund (NSVF) is a national venture philanthropy based in Oakland, CA focused on advancing excellence, innovation, and equity in K-12 education. As both a non-profit and a funder, they raise money to make early-stage investments in the most promising education leaders and ideas. NSVF embraces an expanded definition of student success (EDSS) to help every young person finish high school prepared and inspired to reach their most ambitious dreams and plans. Since 2020, EA has partnered with NSVF to support their EDSS commitments by providing analyses of their Social-Emotional Learning (SEL) and school Culture and Climate (CC) student surveys in conjunction with academic assessment data.
In the past few years, disruptions from COVID-19 have made EDSS even more relevant and pressing. NSVF is eager to understand the relationship between academic outcomes and both SEL and CC factors during COVID. As part of this effort, NSVF has asked EA to investigate ways in which students’ SEL and perceptions of school CC serve as a protective factor for potential decreases in academic outcomes associated with school closures. In other words, can strong SEL or school CC help mitigate the effects of COVID-19 on students’ academic progress?
This question changes the focus of discussion from the negative academic impacts of COVID school closures to what skills students have that made them resilient to these significant challenges. Historic data from the NSVF SEL and CC surveys provided an opportunity to learn about how these non-cognitive factors might be part of a systematic approach to COVID recovery. If student social-emotional strength is associated with lower rates of learning lag, then supporting social-emotional growth in schools could play an important role in COVID learning recovery.
The Survey Measures
Ensuring the strength of the SEL and CC survey measures is vital in order to rigorously investigate their relationship to academic outcomes. The surveys have been administered in both spring and fall to students in NSVF partner schools since 2016-17. Between 2016-17 and 2021-22, we have received 102,786 student survey responses from 72 schools in the NSVF portfolio.
The survey questions (also called items) are grouped into constructs that are designed to measure the same core concept. For example, the items “I can change my intelligence with hard work” and “I am capable of learning anything” are both grouped within the Growth Mindset construct. The SEL survey consists of 7 constructs, and the CC survey consists of 9 constructs. Each question is presented as a statement with 5 response options, often ranging from “Strongly Disagree” to “Strongly Agree.” We score each item response on a 0-4 scale, with 0 indicating the lowest rating and 4 being the highest rating. We apply an item response theory (IRT) model to aggregate these individual item scores into measures at the construct level that we use in our statistical analyses.
Given these surveys measure complex student traits that cannot be observed directly, we have conducted a lot of analyses to provide evidence that supports the reliability, validity, and strength of these measures. Through our partnership with NSVF, our research team has reported on many psychometric diagnostics. For example, we have examined the reliability of each construct, psychometric properties of each item/construct, how correlated the items in a construct are to each other, and how correlated the constructs are to other factors, such as ELA and Math test scores (as measured by NWEA MAP tests). The plot below is one example of this type of diagnostic; it displays the reliability, or internal consistency, of each construct as measured by Cronbach’s alpha from three time periods (pre-COVID fall surveys, pre-COVID spring surveys, and the fall 2020 survey) separately for each grade band (elementary school/ES, middle school/MS, and high school/HS). NSVF has used the findings from our analyses to continuously improve and refine their survey measures.
Internal Consistency of NSVF SEL Measures

Our Methods
In our most recent work, we focused on two questions from our collaborative learning agenda:
- Are changes in students’ academic outcomes, SEL, and perceptions of school CC during the pandemic greater than changes we would expect to see in a typical year?
- In what ways do student-level SEL and perceptions of school CC serve as a protective factor for potential decreases in academic outcomes associated with school closures? Is strong SEL or CC more protective for marginalized student groups?
We first used two approaches to compare changes in student SEL, school CC, and scores on the NWEA MAP assessment during pre-COVID and COVID-impacted years: cross-sectional and longitudinal comparisons. The cross-sectional approach (see graphic below) compares different students across years from the same grade and allows us to understand questions like:
- How do SEL/CC ratings and academic performance change across years at each grade? (For example, 4th graders’ math scores in Fall 2019 vs. 4th graders’ math scores in Fall 2020.)
- How do these outcomes compare in pre-COVID years and in COVID-impacted years? (For example, 4th graders’ average math scores pre-COVID vs. 4th graders’ math scores after Spring 2020.)
Cross-Sectional Approach

The longitudinal approach (see graphic below) follows the same students over time as they age, and allows us to understand questions like:
- How do students’ outcomes change over time? (For example, math scores at the start of 4th grade vs. 5th grade for the same group of students.)
- How do changes in these outcomes differ in pre-COVID years and in COVID-impacted years? (For example, 4th-to-5th-grade math score changes from Fall 2018 to Fall 2019 vs. 4th-to-5th grade changes from Fall 2019 to Fall 2020.)
Longitudinal Approach

For these analyses, we examined MAP assessment data from both the spring and fall terms in three school years (2018-19, 2019-20, and 2020-21) and survey data from both terms across five school years (2016-17 through 2020-21).
We then used data-driven approaches to consolidate the individual SEL and CC construct scores into one overall SEL score and one overall CC score, in order to reduce the amount of statistical noise in the measures and maximize our statistical power given our sample size. We included these overall SEL and CC scores in a statistical model (specifically, a regression model) to estimate how much students’ scores in those domains reduced the degree of learning lag during COVID. Finally, after identifying a significant factor score, we looked at which individual constructs contribute the most to the overall SEL or CC factor, in order to form a hypothesis about which construct might be driving that significant result.
Changes in MAP, SEL, and CC
Unsurprisingly, and in line with national trends given widespread COVID impact, students’ MAP test scores in 2020-21 were significantly lower than previous school years (specifically, when comparing Fall 2020 vs. the average of Fall 2018 and Fall 2019, and when comparing Spring 2021 vs. Spring 2019). In the fall-to-fall comparisons, students in grades 4-8 scored significantly lower in Math and those in grades 5-7 scored lower in Reading. The results were consistent for the spring-to-spring comparisons, with the addition of lower scores for Reading in grade 8. The longitudinal results also showed that changes in MAP Math and Reading scores (both from fall-to-fall and fall-to-spring) dropped significantly after COVID among most student cohorts.
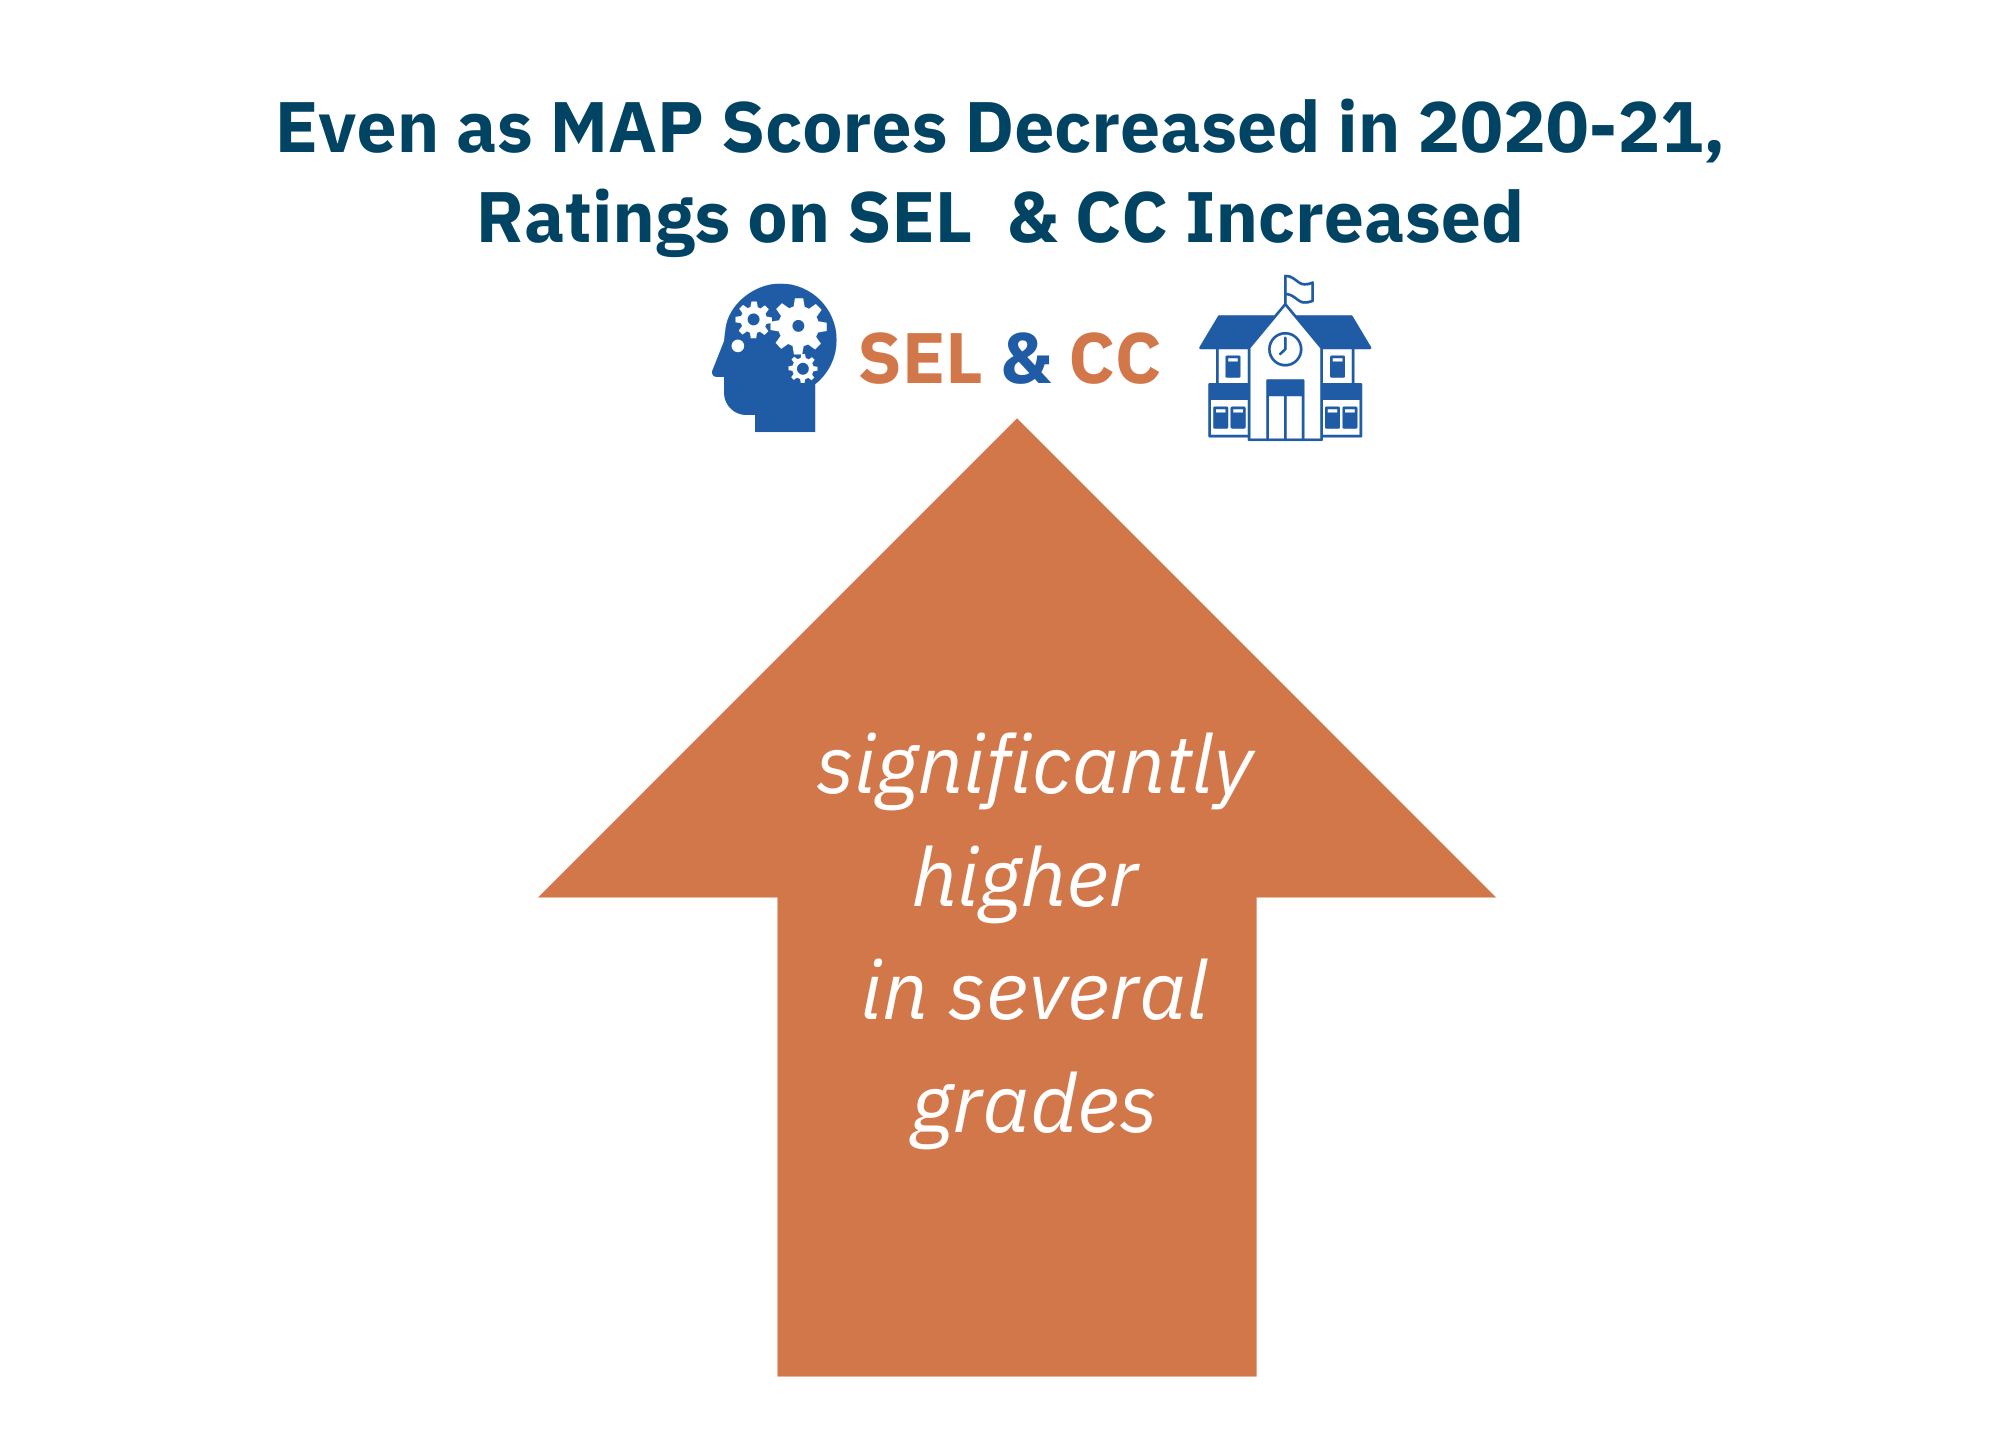
In comparison, ratings on many SEL/CC constructs were significantly higher in several grades in 2020-21 than before COVID. For example, students’ ratings on Teacher-Student Relationships increased significantly in both fall (grades 4-10 and grade 12) and spring (grades 4-11) cross-sectional comparisons. Student ratings on other constructs, such as Rigorous Expectations, Fairness, School Safety, Engagement, and Self-Management, also increased in many grade levels. Longitudinal changes in these constructs’ ratings also increased significantly when comparing typical changes (i.e., from Fall 2018 to Fall 2019, from Fall 2018 to Spring 2019) with COVID-impacted changes (from Fall 2019 to Fall 2020, from Fall 2019 to Spring 2021).
Protective SEL/CC Factors
Over an 18-month time period between Fall 2019 and Spring 2021, both students’ SEL and their perceptions of school CC were found to be positively associated with their academic growth, as measured by MAP Math and Reading tests. In other words, higher SEL or CC were correlated with higher academic growth.
More importantly, we found that SEL served as a protective factor for middle school girls in their math performance. As the figure below shows, overall changes in MAP Math scores among middle school girls were 2 score points higher than boys (as shown by the dark green and light green dotted horizontal lines). In other words, middle school girls tended to make slightly more progress in math over these 18 months than boys did. However, girls with higher SEL skills pre-COVID (compared to their female peers) maintained similar levels of growth in MAP Math—meaning, they did not experience learning lag. Specifically, in Spring 2021, middle school girls with SEL scores that were substantially above average (i.e., 2 standard deviations above the mean) scored 9.4 points higher on MAP (i.e., half a standard deviation) than those whose SEL scores were substantially below average (i.e., 2 standard deviations below the mean). You can see this in the plot below: The dark green bar (for female students) for “2 SD Above Mean” is taller than the dark green bar for “Mean” or “2 SD Below Mean,” whereas the light green bars (for male students) do not show as large of a difference.
SEL serves as a protective factor for middle school girls in math performance

When we examined which constructs within the SEL survey (available here) contributed most to the overall SEL measure, we found that Perseverance, Learning Strategies, Self-Efficacy, and Self-Management were the top contributors, suggesting that these skills specifically may serve as a protective factor against learning lag in math during COVID among middle school girls. The implication of this is that educators could intentionally build students’ traits in these areas, particularly among middle student girls, as one strategy to help minimize the adverse impact of the pandemic.
What Comes Next
With more survey data becoming available, we look forward to extending this investigative work to understand longer-term COVID effects on students’ SEL/CC ratings, and whether and how the associations between students’ SEL/CC and academic outcomes continue to evolve.
This year, EA and NSVF have begun collaborating on a broader set of learning questions to explore potential relationships with new data sources and EDSS outcomes. Some of our future work will (1) examine how data from the NSVF school application process and operational data from NSVF schools yield insights into improving student outcomes, (2) expand to include other kinds of student outcomes such as graduation rates, and (3) explore patterns in schools’ success at closing opportunity gaps as they progress from Year 1 to Year 2 to Year 3 and beyond in their operations. Each of these ties into NSVF’s overall Innovative Public Schools logic model, the evolution of the EDSS framework, and management assistance supports that NSVF provides to school leaders.
Finally, NSVF has expressed an interest in maximizing the EDSS insight generation process that emphasizes the practical use of SEL and CC survey data while minimizing the survey burden on schools and students. To support this, EA plans to engage in additional psychometric analyses to make data-driven recommendations for how to streamline the survey instrument without sacrificing measurement quality. We plan to work on this continuous improvement of the survey to prepare for the survey administration in Fall 2023.
You can read more about the insights that the NSVF team has generated for their educators from these analyses in this NSVF Insights Blog.