
Great attention has been focused on what has been called "learning lag," "unfinished learning," or "learning loss" during the COVID-19 pandemic as measured by student benchmark or interim assessments. These data have shown that younger students have been especially impacted by school closures and pandemic-related impacts on learning. But what about students in older grades? Interim and benchmark assessments are used more sparingly in high school, as students have more flexibility in the courses they take, and particular courses may be more or less aligned to standards measured by benchmark assessments. To understand the impact of COVID-19 on high school students, we need to turn to other sources of data, including grades, attendance, and course-taking patterns. Our preliminary analyses of these data in a large set of California districts suggests a worrying trend: Many more youth struggled to engage in school and to pass their classes in the 2020-21 school year than in the past.
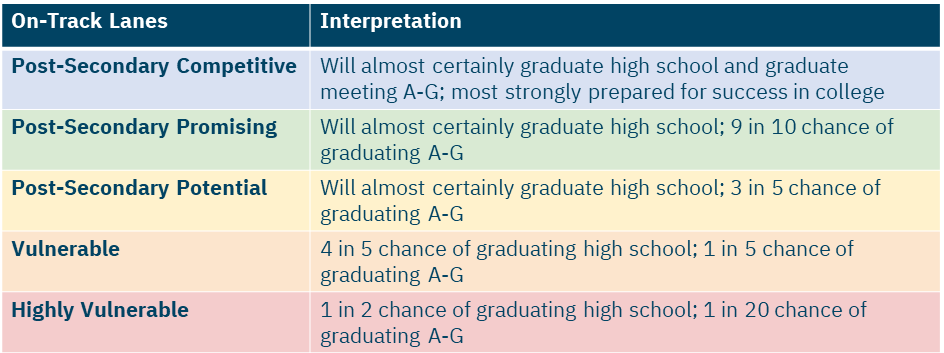
At Education Analytics, we have the privilege of supporting several Networks for School Improvement (NSIs) in California, which collectively work with more than 30 school districts and Charter Management Organizations (CMOs) of various sizes across the state. These NSIs are working to improve students’ “on-track” status towards high school graduation and post-secondary readiness. In collaboration with the California CORE Districts and CORE Data Collaborative, we have developed an on-track points system anchored on students’ likelihood to graduate from high school and their likelihood to graduate meeting California’s A-G college entrance requirements . Students fall into one of five "lanes"—highly vulnerable, vulnerable, post-secondary potential, post-secondary promising, or post-secondary competitive—based upon a 0 to 100 scale informed by students’ strength of course-taking schedule, course grades, attendance, and, when available, test scores. These lanes range from students at greatest risk of not graduating from high school to students who will almost certainly graduate prepared for four-year college success, with gradations in between.
Trends in Students' On-Track Rates
In examining data from thousands of students across 22 Local Education Agencies (LEAs, which includes school districts and CMOs), we see a consistent and concerning trend. Whereas we typically find somewhere in the range of 15% of students who are exhibiting “highly vulnerable” levels of performance and engagement in school, those levels have approximately doubled in the 2020-21 school year, with approximately 30% of students in this most concerning lane of on-track status.
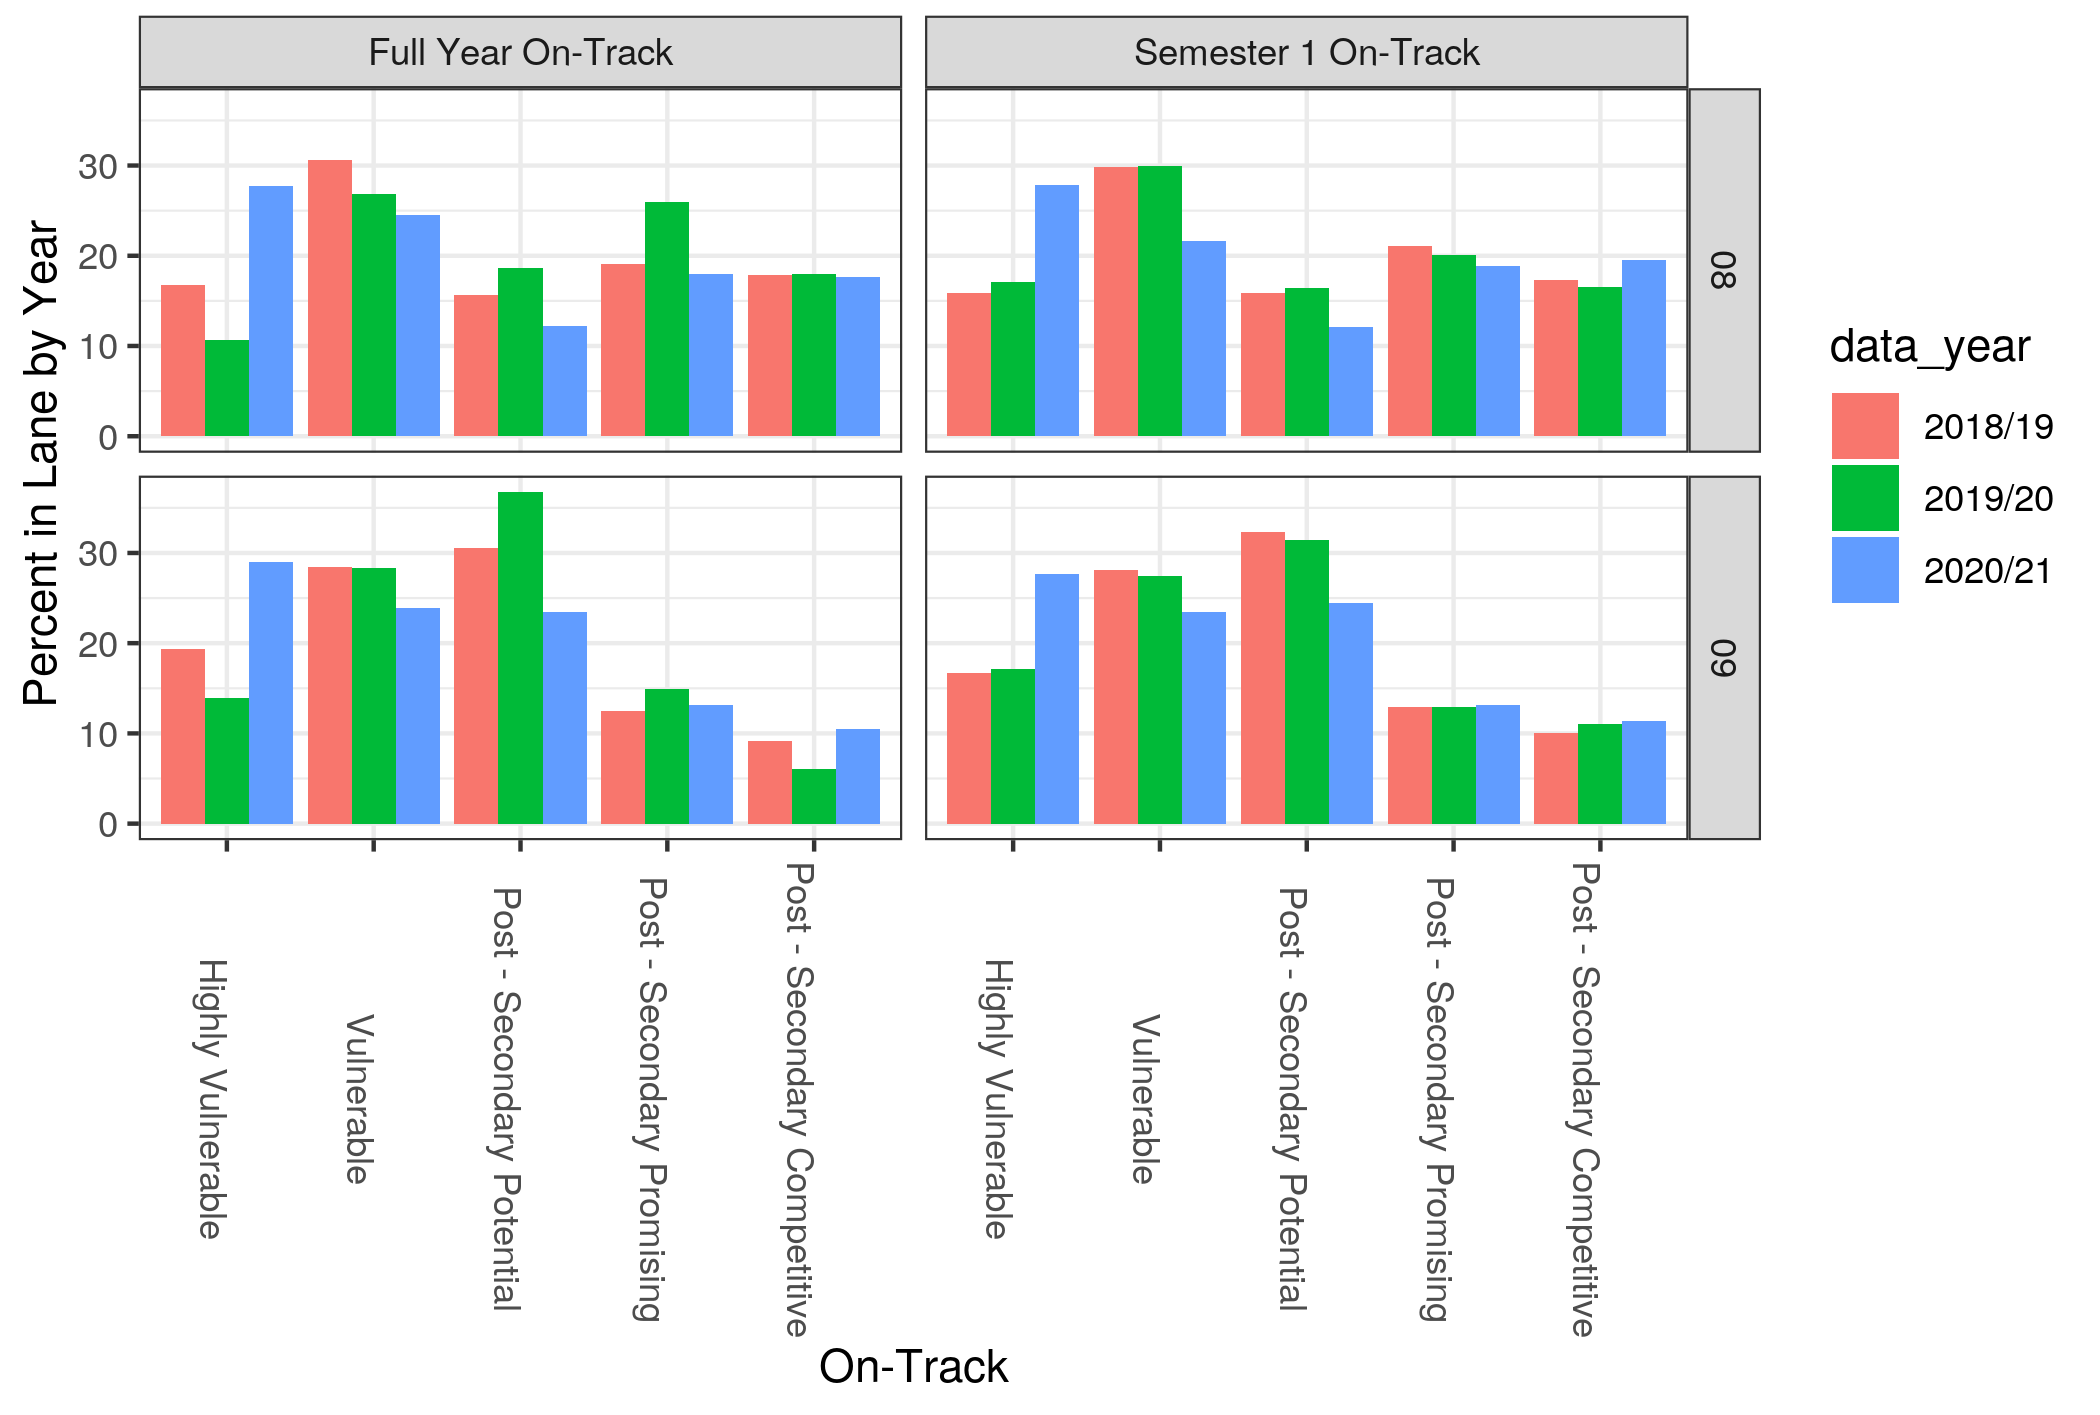
In the chart above, we find many more students in 8th grade (top panel) and 9th grade (bottom panel) in 2020-21 (blue bars) within these 22 LEAs who are in the lowest on-track category, highly vulnerable. The panel on the left indicates on-track status based on all data from the 2020-21 school year. The panel on the right indicates on-track status based on data from the first semester only. In both panels, and for both 8th and 9th grades, we see approximately 30% of students in the highly vulnerable category, but the rates were typically closer to approximately 15% in 2018-19 (red bars) and 2019-20 (green bars). In contrast, the proportion of students at the upper end of preparedness (post-secondary promising and post-secondary competitive) remained fairly consistent with prior years. This evidence suggests that some set of students who would be more in the middle of the on-track distribution before COVID-19 are now showing greater vulnerability during the pandemic.
When we dig deeper into these data and examine the factors driving these concerning trends, we see that student course-taking patterns in 2020-21 look consistent with prior school years, so it is not the case that students were taking on a less rigorous course load. Instead, what we see is an increased clustering of students in the lowest categories of attendance and GPA. Functionally, we see double or triple (depending on the grade level) the proportion of youth consistently failing most of their classes (in the 0 to 1 GPA range), and approximately double the proportion of students attending school less than 80 percent of the time (meaning they are missing on average one or more days of school per week).
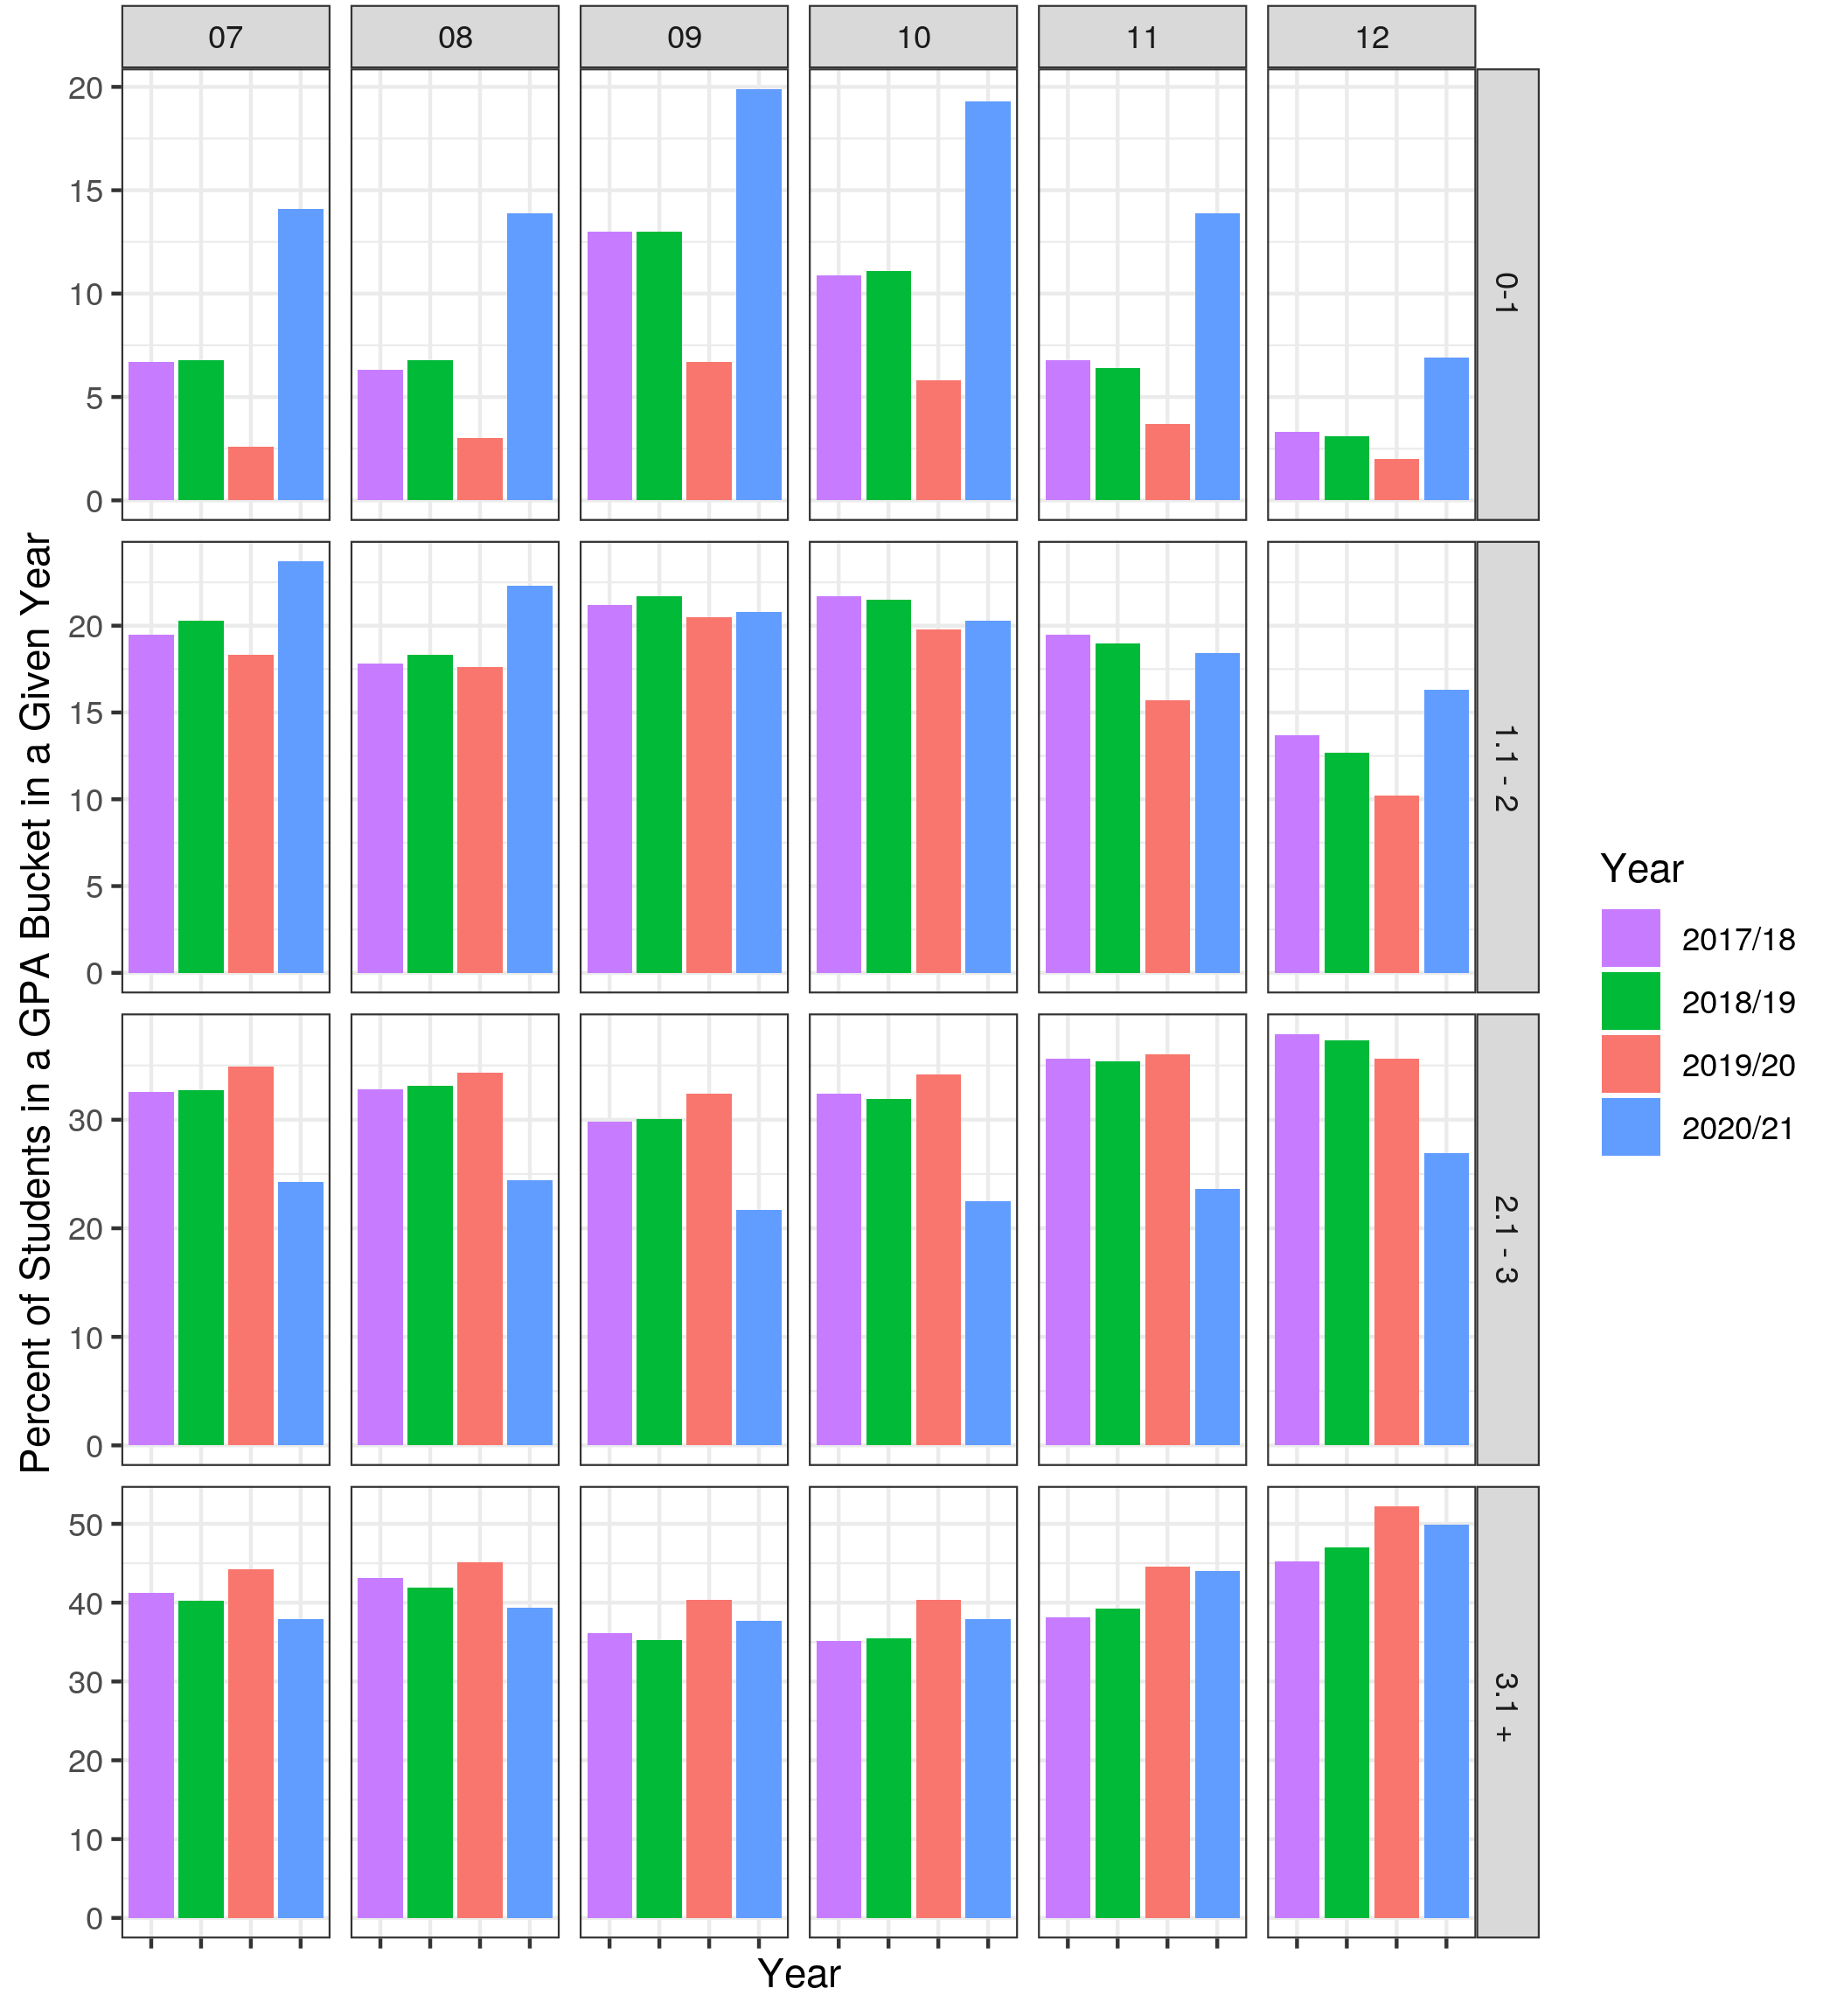
Patterns in Students' Grades
The chart below shows the concentration of students in the 0-1 GPA bucket in 2020-21 (blue bars). In previous years, the percentage of students in the first bucket (GPA 0-1) was lower than 12%, and as low as 3% in some grades. In 2020-21, grades 9 and 10 show almost 20% of their students in this bucket. The next bucket (GPA 1.1-2) also shows a greater number of students in 2020-21, especially for grades 7, 8, and 12. In contrast, the third bucket (GPA 2.1-3) shows only 20-25% of students in 20-21, while in previous years those numbers were always above 30%. The number of students with a GPA of 3.1+ is fairly consistent across different years.
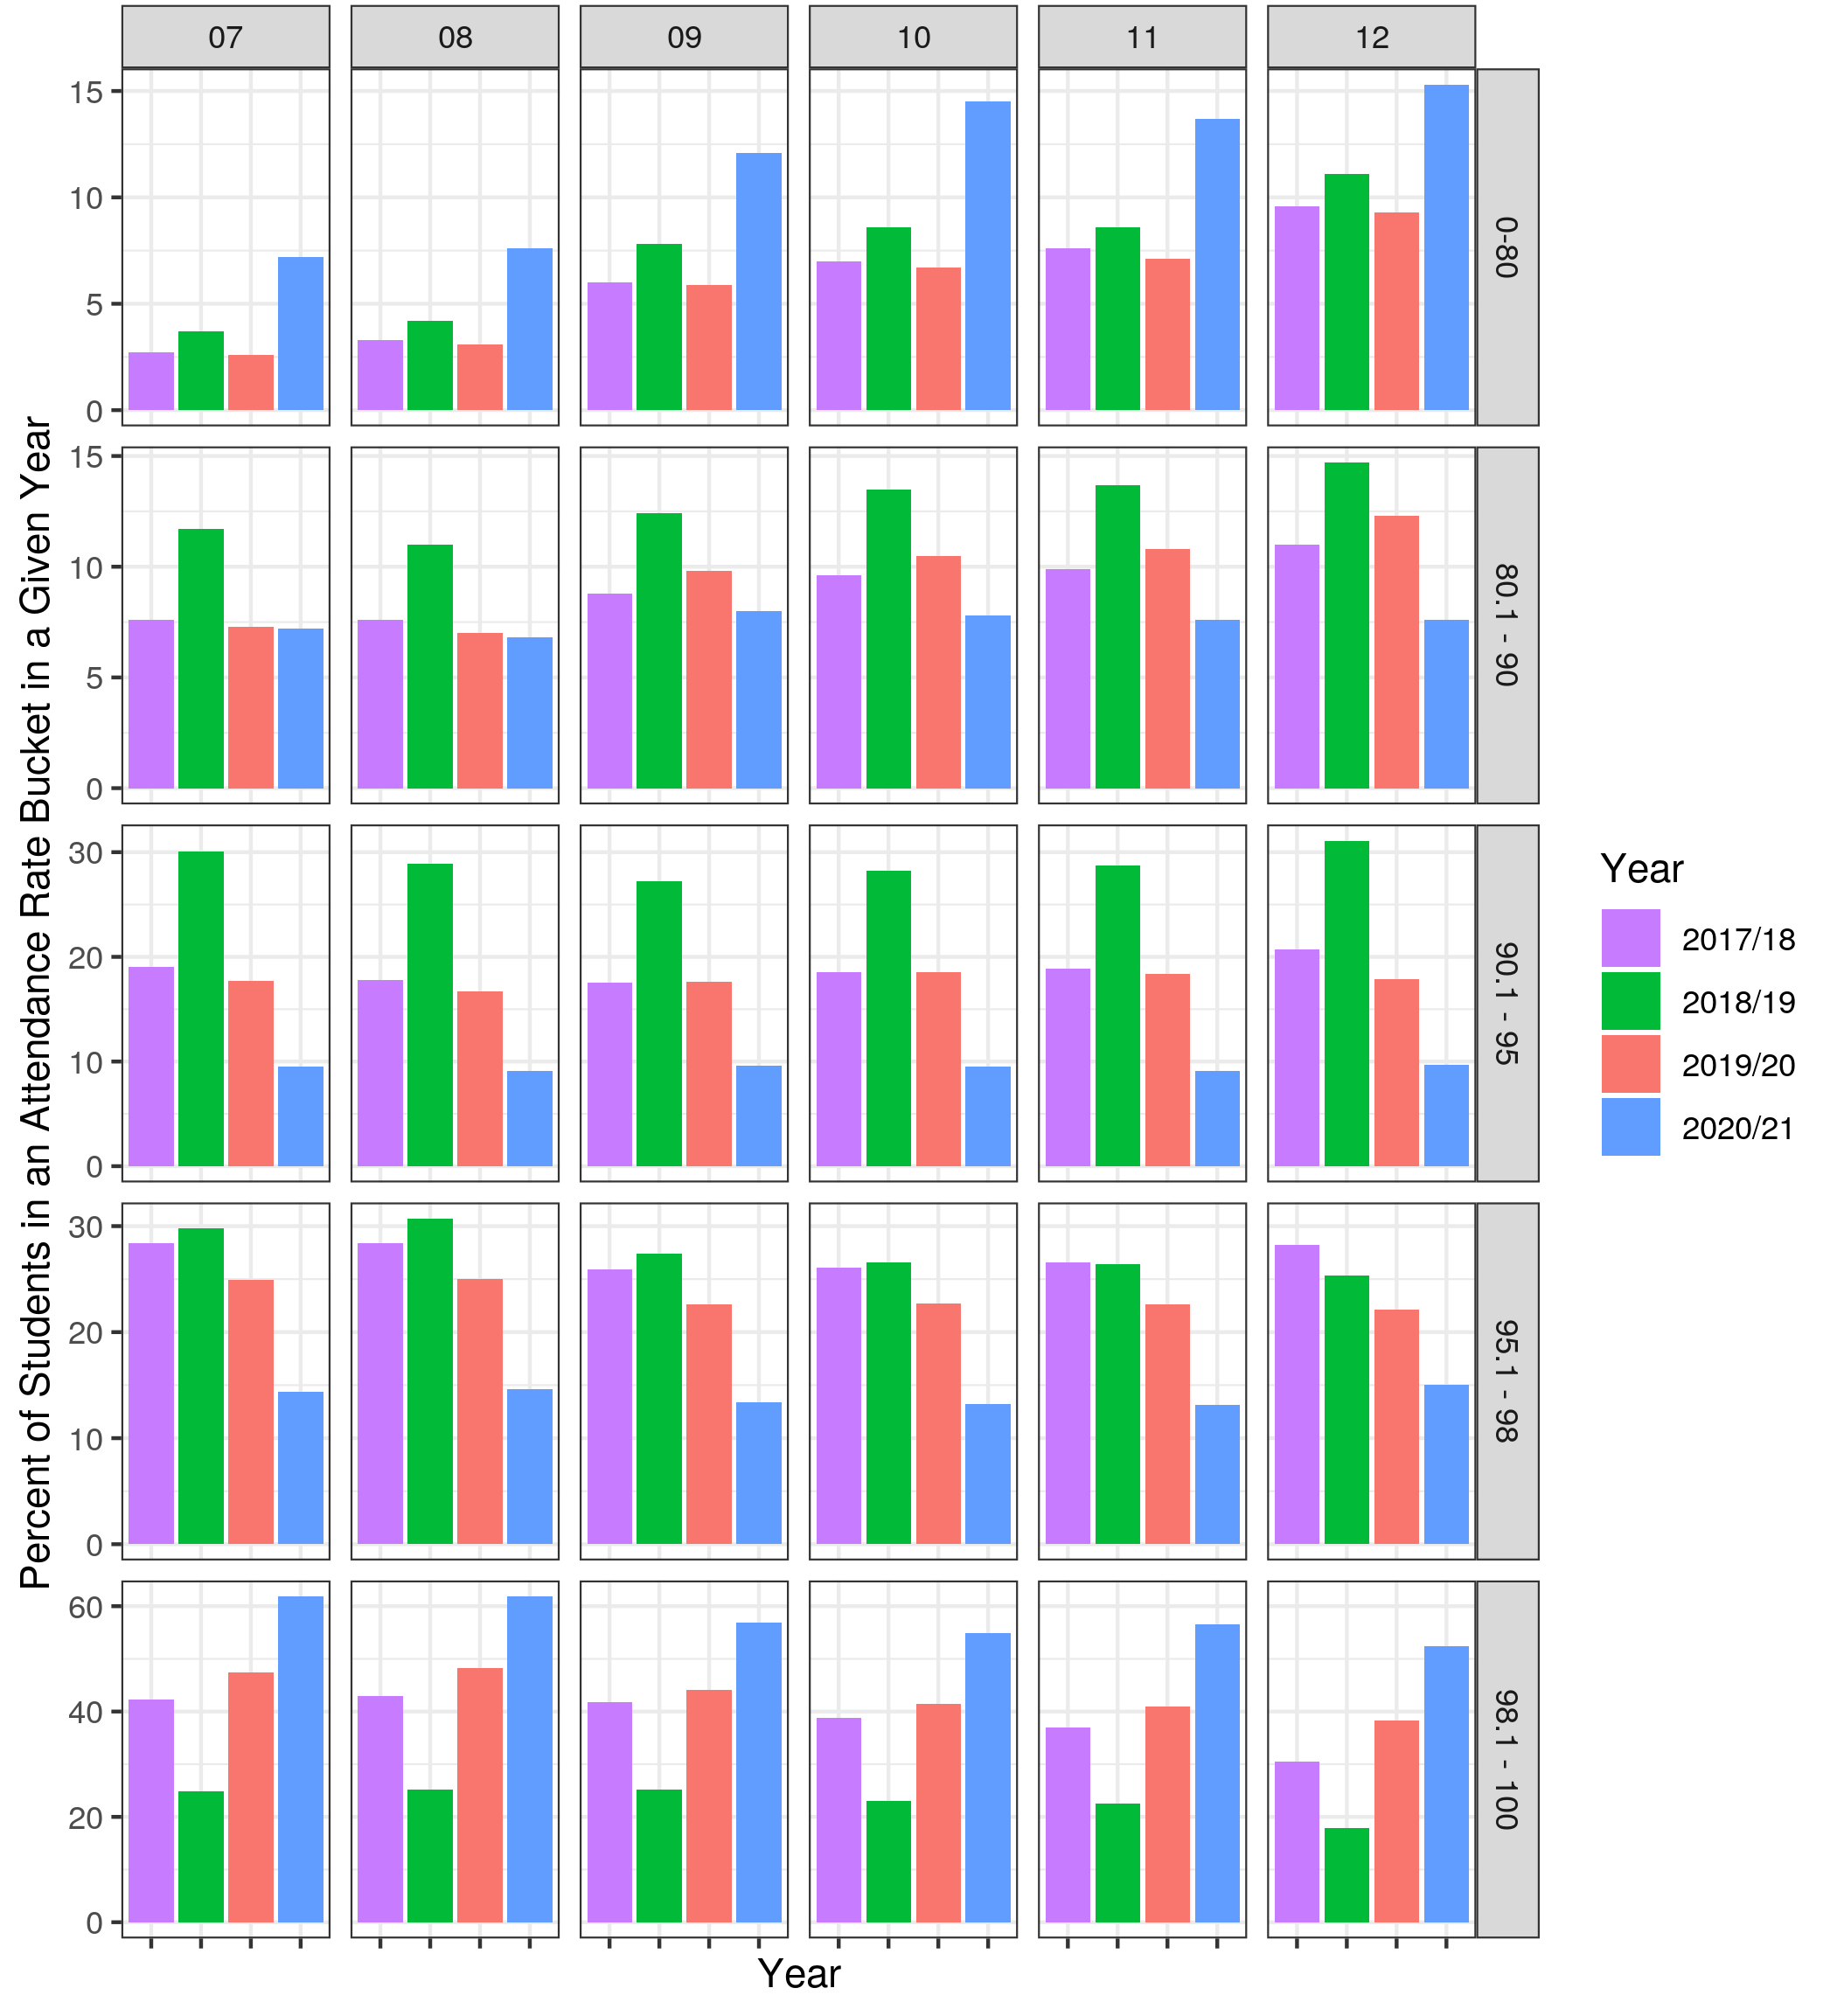
Patterns in Students' Attendance
The chart below shows that in 2020-21 (blue bars), more students had an attendance rate of 98% or more (bottom panel) compared to prior years, but a larger proportion of students also had an attendance rate less than 80% (top panel). For instance, in 9th grade (third column), around 12% of students attended school less than 80% of the time, which is almost double that of previous years; the number of students with attendance between 80-98% was lower than in previous years (panels 2, 3 and 4); finally, about 58% of students attended more than 98% of the days, which is higher than any other year in the chart. In other words, fewer students were in the middle of the attendance range, with many more students in the lowest range and an increase in students in the highest range. This may be due to differential access to virtual learning, or due to differences in how attendance was recorded during virtual learning.
What The Data Show
Generally, when we look at the upper end of the range of on-track status, we see consistent patterns in comparison to prior years. Where we see fewer youth is in the middle of the distribution. Essentially, we have students who, in a typical year, we would expect to see more in the middle of the range who have instead exhibited evidence of disengagement from school.
While someone looking purely at the assessment analytics about learning lag might have come to the conclusion that we need to maximally invest in younger youth in our COVID recovery efforts, this data suggests that we also have a significant challenge to tackle in the upper grades. While middle and high schools may be generally geared toward deep intervention with about 10% or so of their population, they may be facing a situation where one out of every three students has fallen significantly behind. We also know that this varies by school. In some schools, the issue is certainly even more concerning.
It’s quite possible that the return to in-person schooling in Fall 2021 will be enough for many of these youth to get back on a more typical track. For students, parents, schools, and LEAs, the first student progress reports in 2021-22 (which typically come out between five and ten weeks into the school year) are going to be more important than perhaps ever. Schools will seek to use such progress reports, along with other sources of information, to distinguish among students whose severe academic challenges were acute due to the disruptive nature of 2020-21 schooling versus those with a more enduring set of conditions to address.
Importantly, these trends raise questions about how to accurately interpret student data across pre-COVID and COVID-affected years. For instance, on-track measures of success are based upon historical pre-COVID data, and it’s possible (if not likely) that changes to grading policies in response to COVID or unreliable attendance record keeping during remote schooling play some role in different patterns in these outcomes during COVID. What this means is that some caution is warranted around interpreting outcome data and predictive measures during COVID. Nevertheless, these data and metrics are still useful for identifying students in need of support, as the rank order of students should still be generally accurate. In other words, although the absolute interpretation of on-track measures across years may be less accurate, the relative standing of students is still informative.
At the end of the day, these data represent real experiences of youth during the last school year. Even without sophisticated analytics, it is clear that when students are failing more classes and consistently missing a significant amount of school, this requires immediate attention, intervention, and support from schools and LEAs. At EA, we are humbled by the opportunity to partner with districts, charter management organizations, states, funders, and others who are working hard to use these data to inform the ongoing recovery process.