EA provides Student Learning Objective (SLO) results annually. The SLO approach compares the Fall-to-Spring growth of your students to NWEA's growth norms. The approach includes an adjustment for the standard error of growth to ensure students will only fail to meet their growth goal if their growth is statistically different from the growth norm. The result is a percentage of students whose growth meets or exceeds the growth norms translated to a 0-20 scale compatible with §3012-D's requirements.
To illustrate the SLO approach, the following example indicates how a particular student’s target is set and how EA’s adjustment is used when determining if the student met the growth goal.
Step-by-Step Conceptual Example
Step 1: Define Student Target
Let’s say a 5th grade math student’s NWEA-provided growth norm is 9.91 RIT points. We call this the target.
This means NWEA has determined that typical growth for 5th grade students with a similar starting point and similar weeks of instruction is 9.91 RIT points.
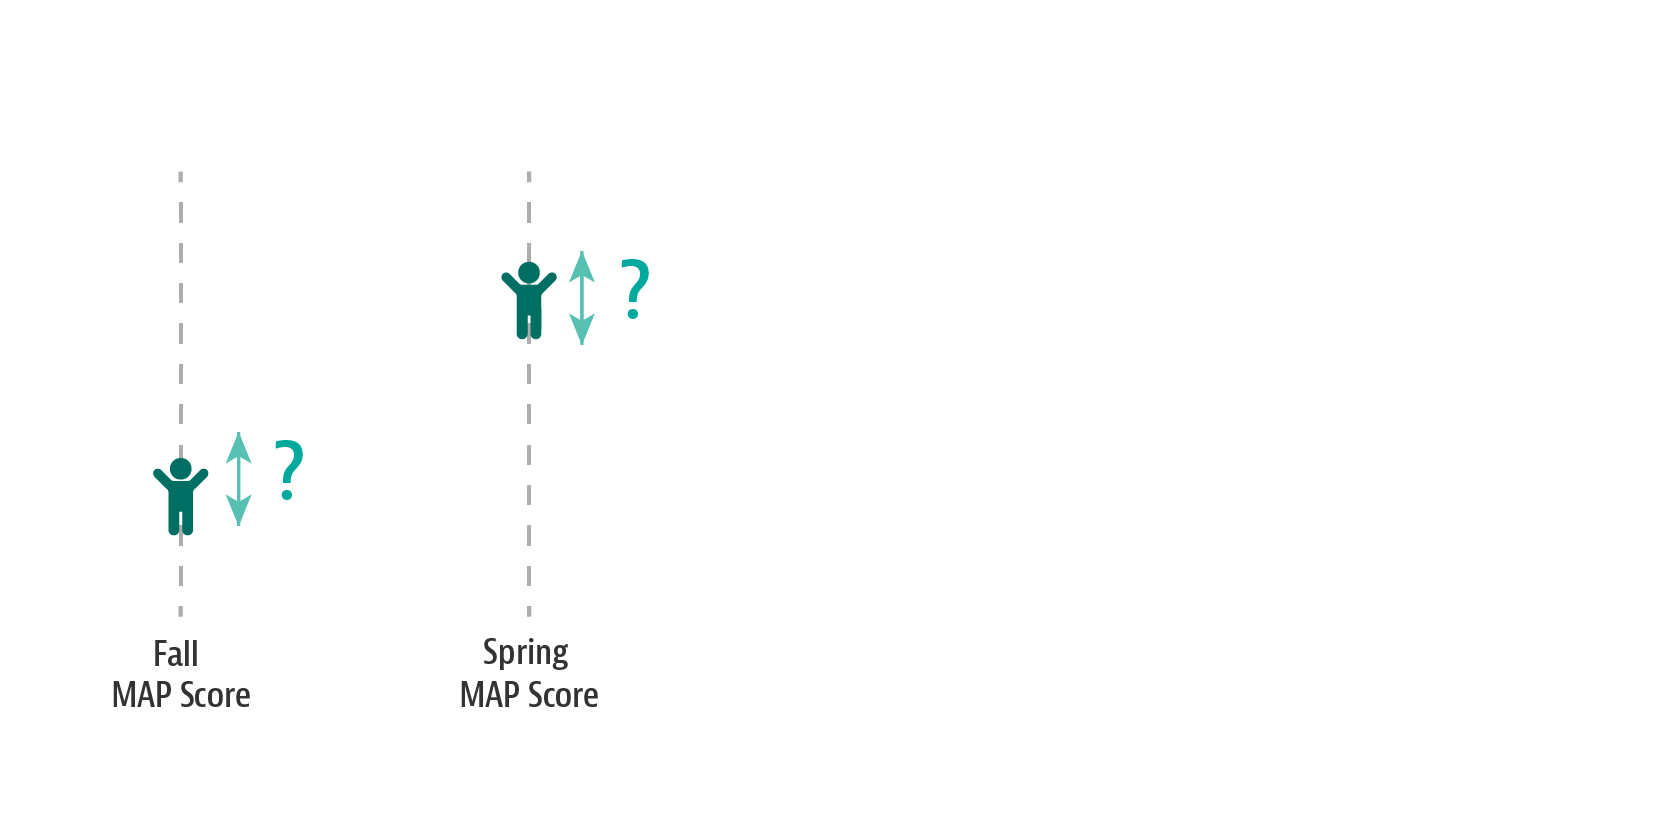
Step 2: Measure Student Growth in RIT Points
EA determines how many RIT points the student grew between the fall and spring test events. In this case, the student grew 8 RIT points.
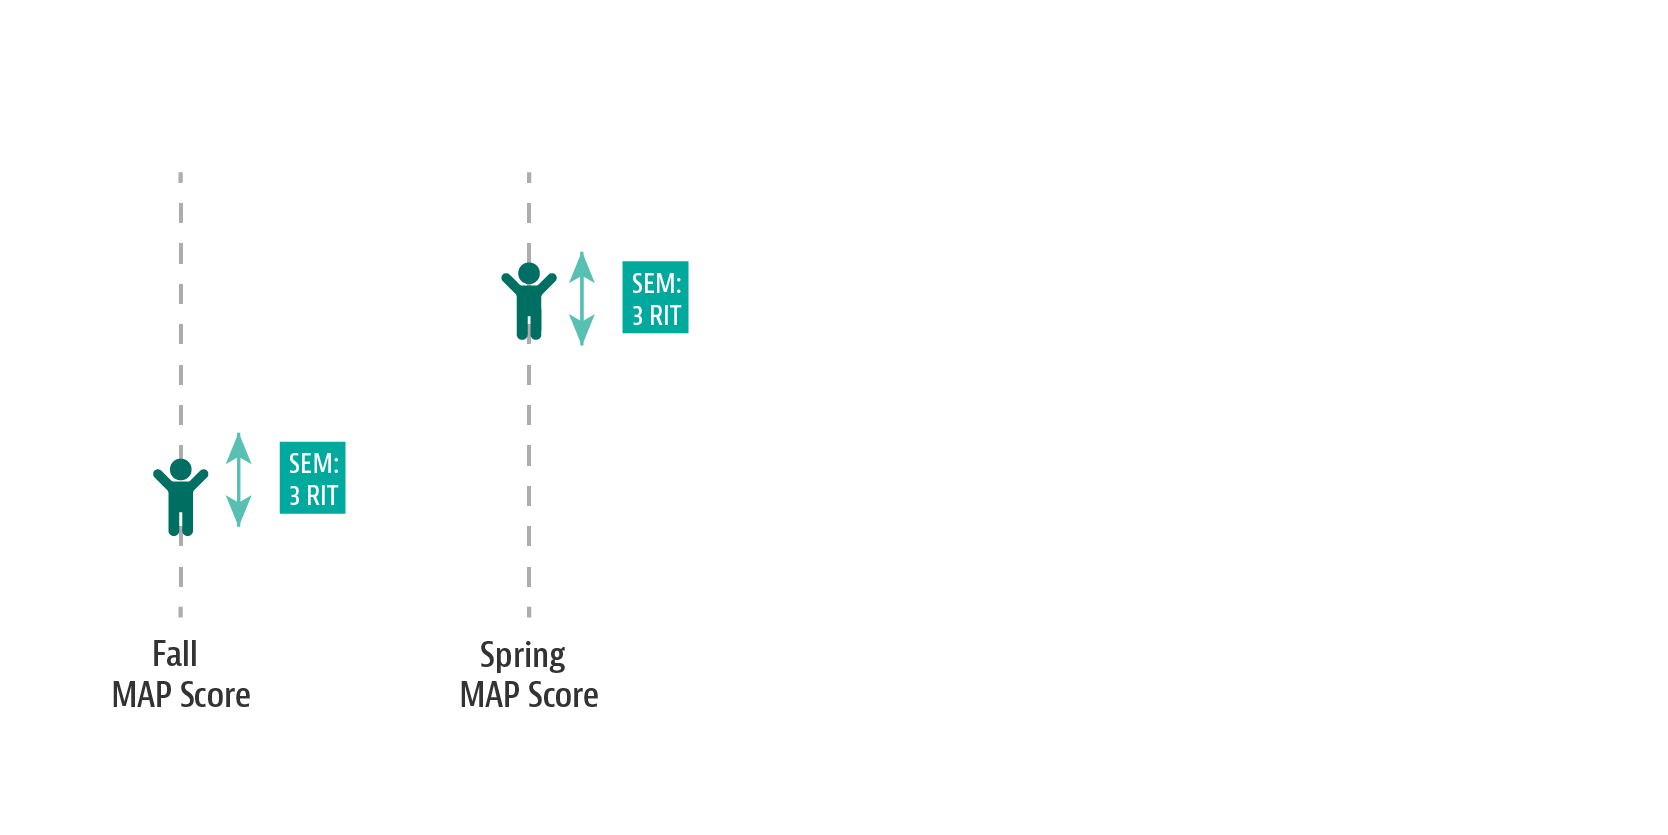
Step 3: Create Student’s Standard Error of Growth Band
EA calculates a standard error of growth band for each student. NWEA MAP Growth produces a metric called the “standard error of measurement” (SEM) for every student test event based on many factors. EA creates a “standard error of growth band” equivalent to 1.6 standard errors of growth. By using the “standard error of growth band,” students will only fail to meet their target if their growth is statistically different from the growth norm.
All test scores have some degree of error associated with them.
A typical Standard Error of Measure (SEM) is 3 RIT points.
EA has developed a formula to creating a “standard error of growth band” for each student. These calculations are all performed on EA’s end and are included in the results EA provides back to each district. The formulas are provided below to provide transparency on the method.
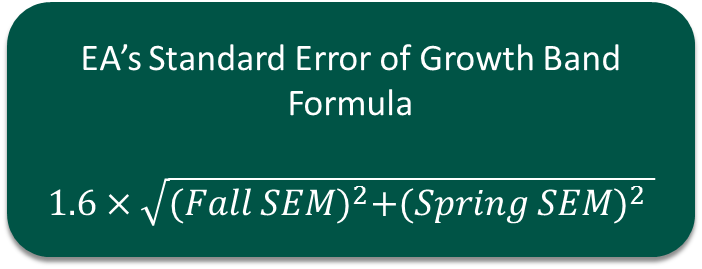

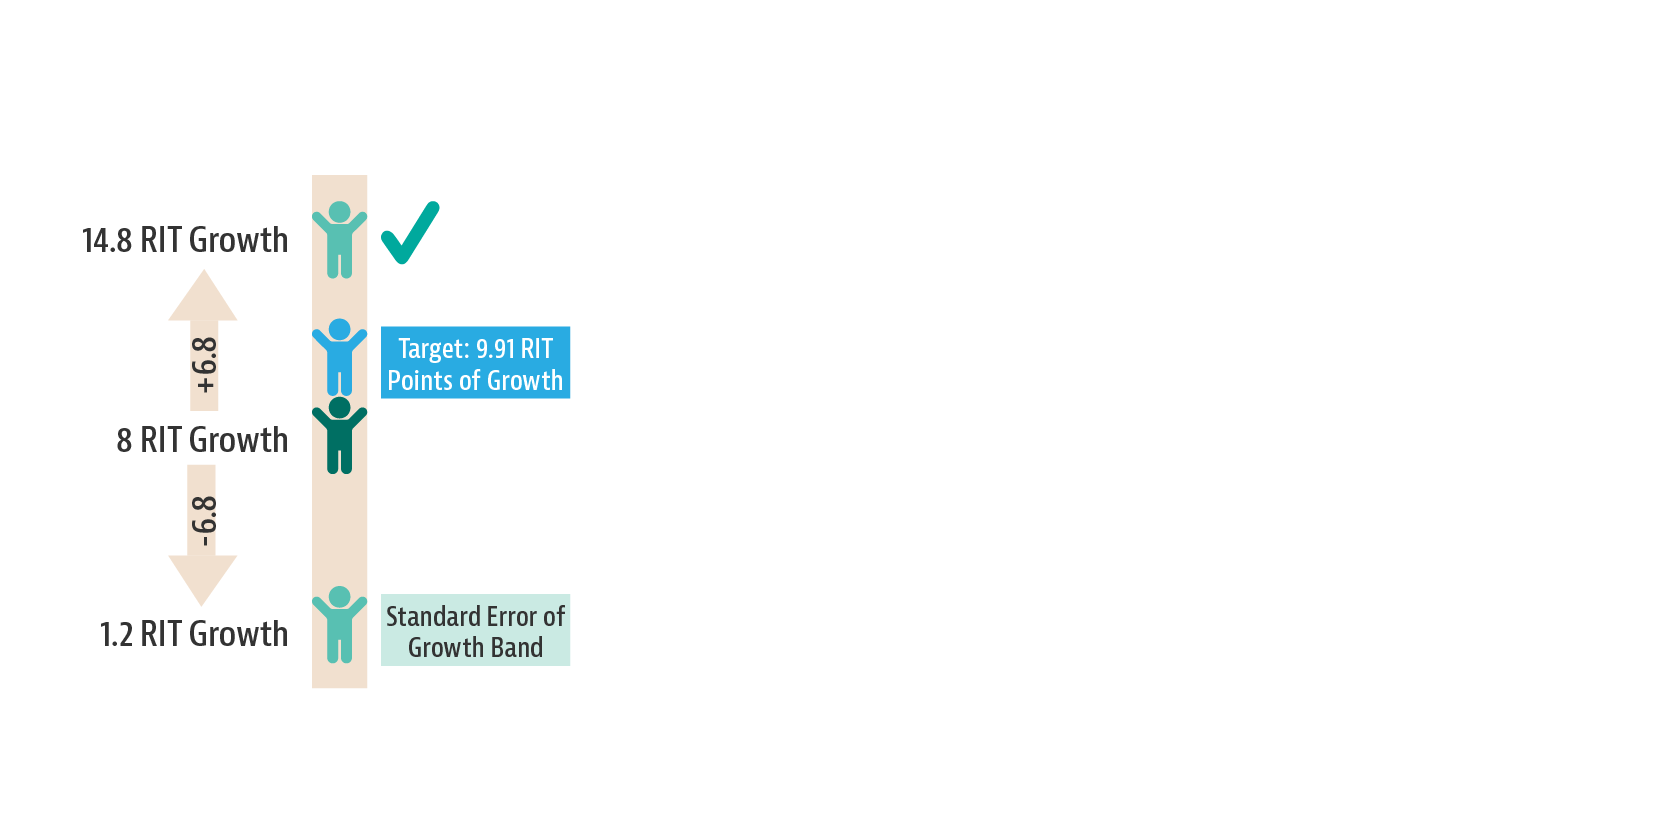
Step 4: Determine if Student’s Adjusted Growth was Equal to or Greater Than the Target
Our student’s growth was 8 RIT points. If our student had an SEM of 3 for each test event, the “standard error of growth band” formula results in 6.8 RIT. That means the “standard error of growth band” for this student is 1.2 RIT to 14.8 RIT. Since 14.8 RIT is greater than the target (9.91 RIT), this student met the target.
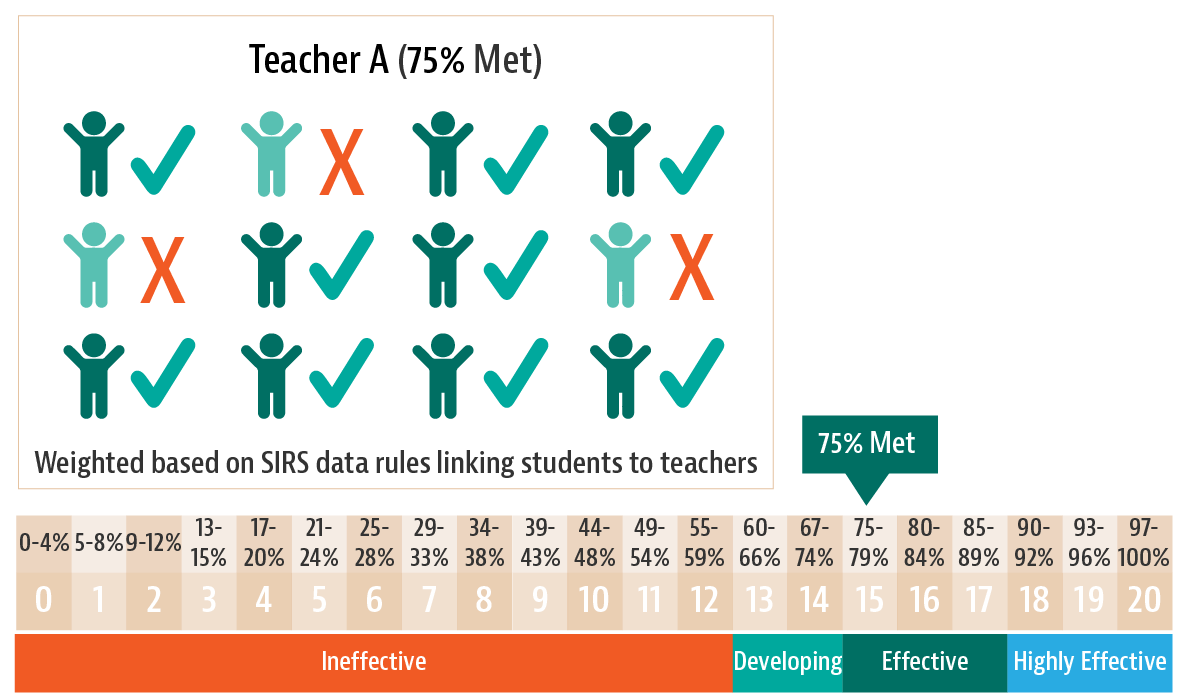
Step 5: For each teacher, create percentage of students who met the target based on the SIRS data linking students to teachers and map each teacher’s “percentage met” to state-defined 0-20 translation for HEDI
In this example, 75% of this teacher’s students met their targets after the “standard error of growth band” adjustment was applied. This teacher would receive a 15 on the HEDI scale based on the state’s SLO translation.
Why does EA make an adjustment when determining if a student met the growth target?
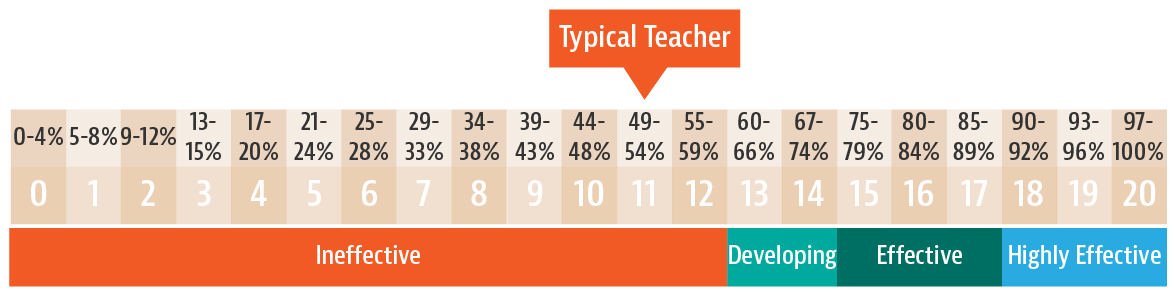
In a classroom with nationally average students and a teacher producing typical growth, only about half of the students will meet the growth norm, resulting in an “Ineffective” HEDI rating for a typical teacher.
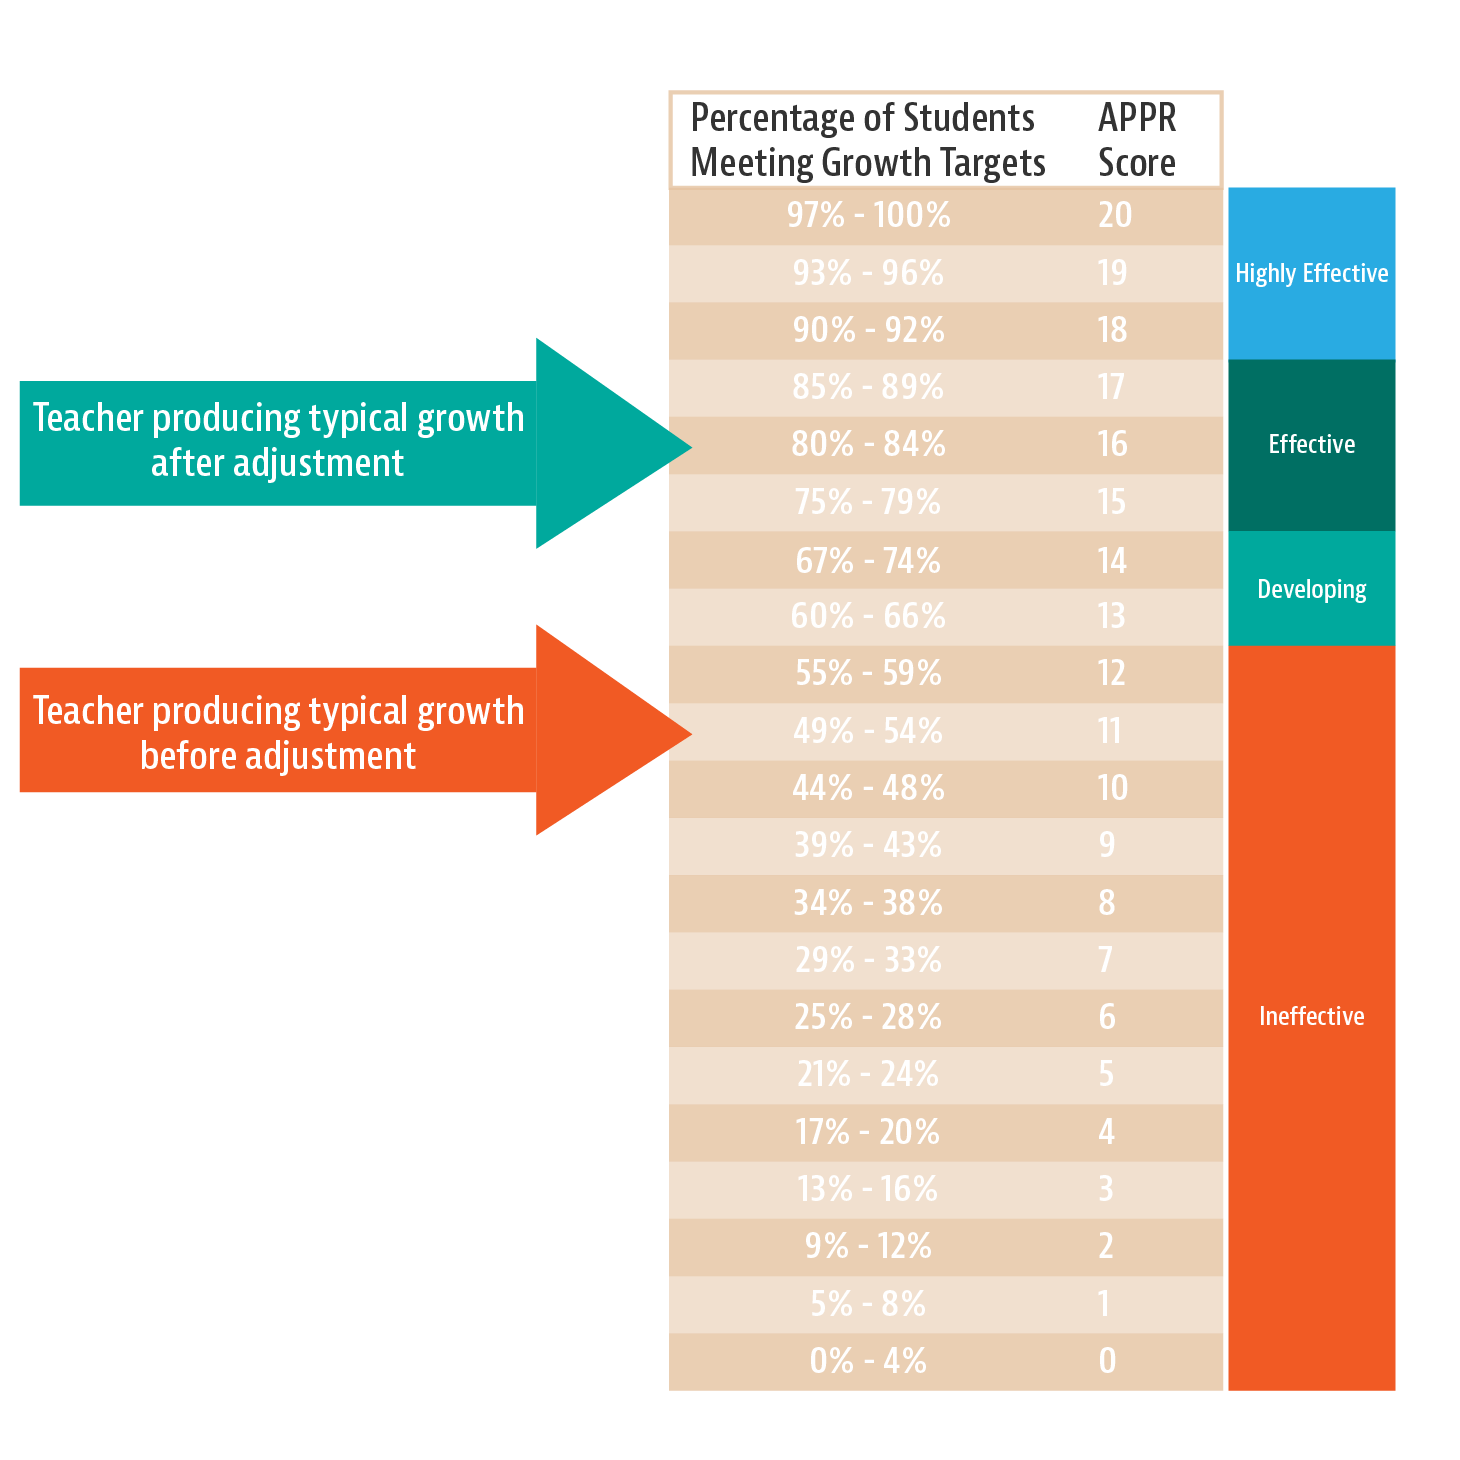
To keep the target based on the NWEA national growth norm and to have reasonable HEDI outcomes for educators, EA makes an adjustment when determining whether a student met the Target.
After adjusting for the “standard error of growth band”, a teacher producing typical growth will tend to have a HEDI score in the Effective range.
Questions?
For more information or specific questions about EA’s SLO approach, please contact us at newyorkappr@edanalytics.org